The past and future of energy
- There is no perfect source of energy. All involve trade-offs.
- Coal and natural gas produce pollution, hydro causes radical changes to an ecosystem, nuclear produces long-term waste, and wind and solar are intermittent.
- Different countries have different priorities and, hence, are choosing different energy strategies.
There are several major sources of energy used to generate electricity by utilities around the world: coal, natural gas, hydro, nuclear, wind, and solar. The desirability of these sources has changed over the decades. What does the future hold for each of them?
Coal
There is an historic pedigree with coal-based electricity generation dating back to Edison’s Pearl Street Station in Manhattan and Holborn Viaduct Station in London, both of which began operation in 1882. In the early days of electricity, coal made sense. There were not many electricity generation options in the late 1800s, well before nuclear power or solar photovoltaics, but coal was in plentiful supply thanks to the development and evolution of the steam locomotive and blast furnace in prior decades. Coal is easy to transport and has high energy density, a mark of a good fuel.
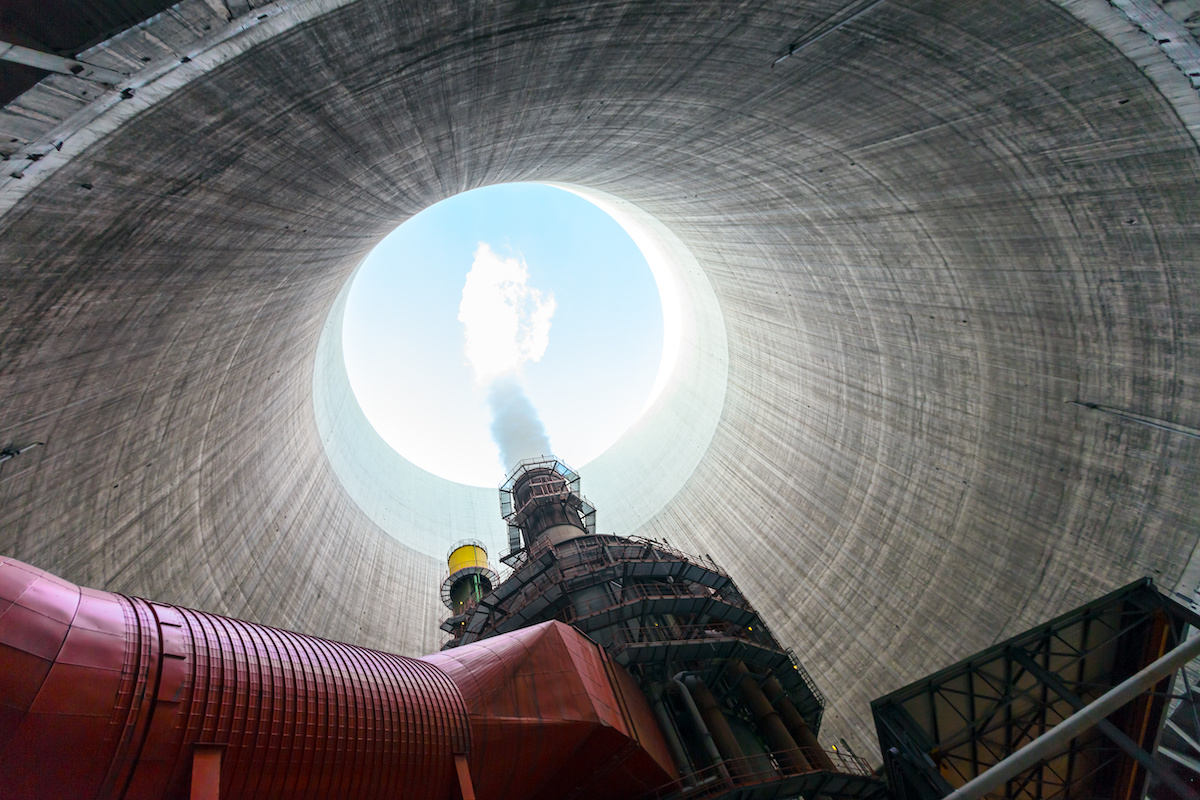
In more recent times, coal seems to be going the way of the steam locomotive as new technologies and changing priorities drive electric utilities and independent generators away from coal. That does strike a blow against American energy independence since the U.S. is known as “the Saudi Arabia of coal” with over 25% of the world’s coal reserves. Alas, it’s a tough sell these days, since coal produces twice the carbon of natural gas, plus varying levels of particulates and acid rain. Clean coal technologies (coal washing, flue gas scrubbing, sequestration) reduce these pollutants, but coal is still the dirtiest of the electricity generation approaches. New EPA mandates for greenhouse gas emissions continue to drive up both capital costs and operating costs. Levelized cost of electricity for coal-based power in the U.S. presently runs at $112/MWh, which is expensive relative to most other methods of electricity generation.
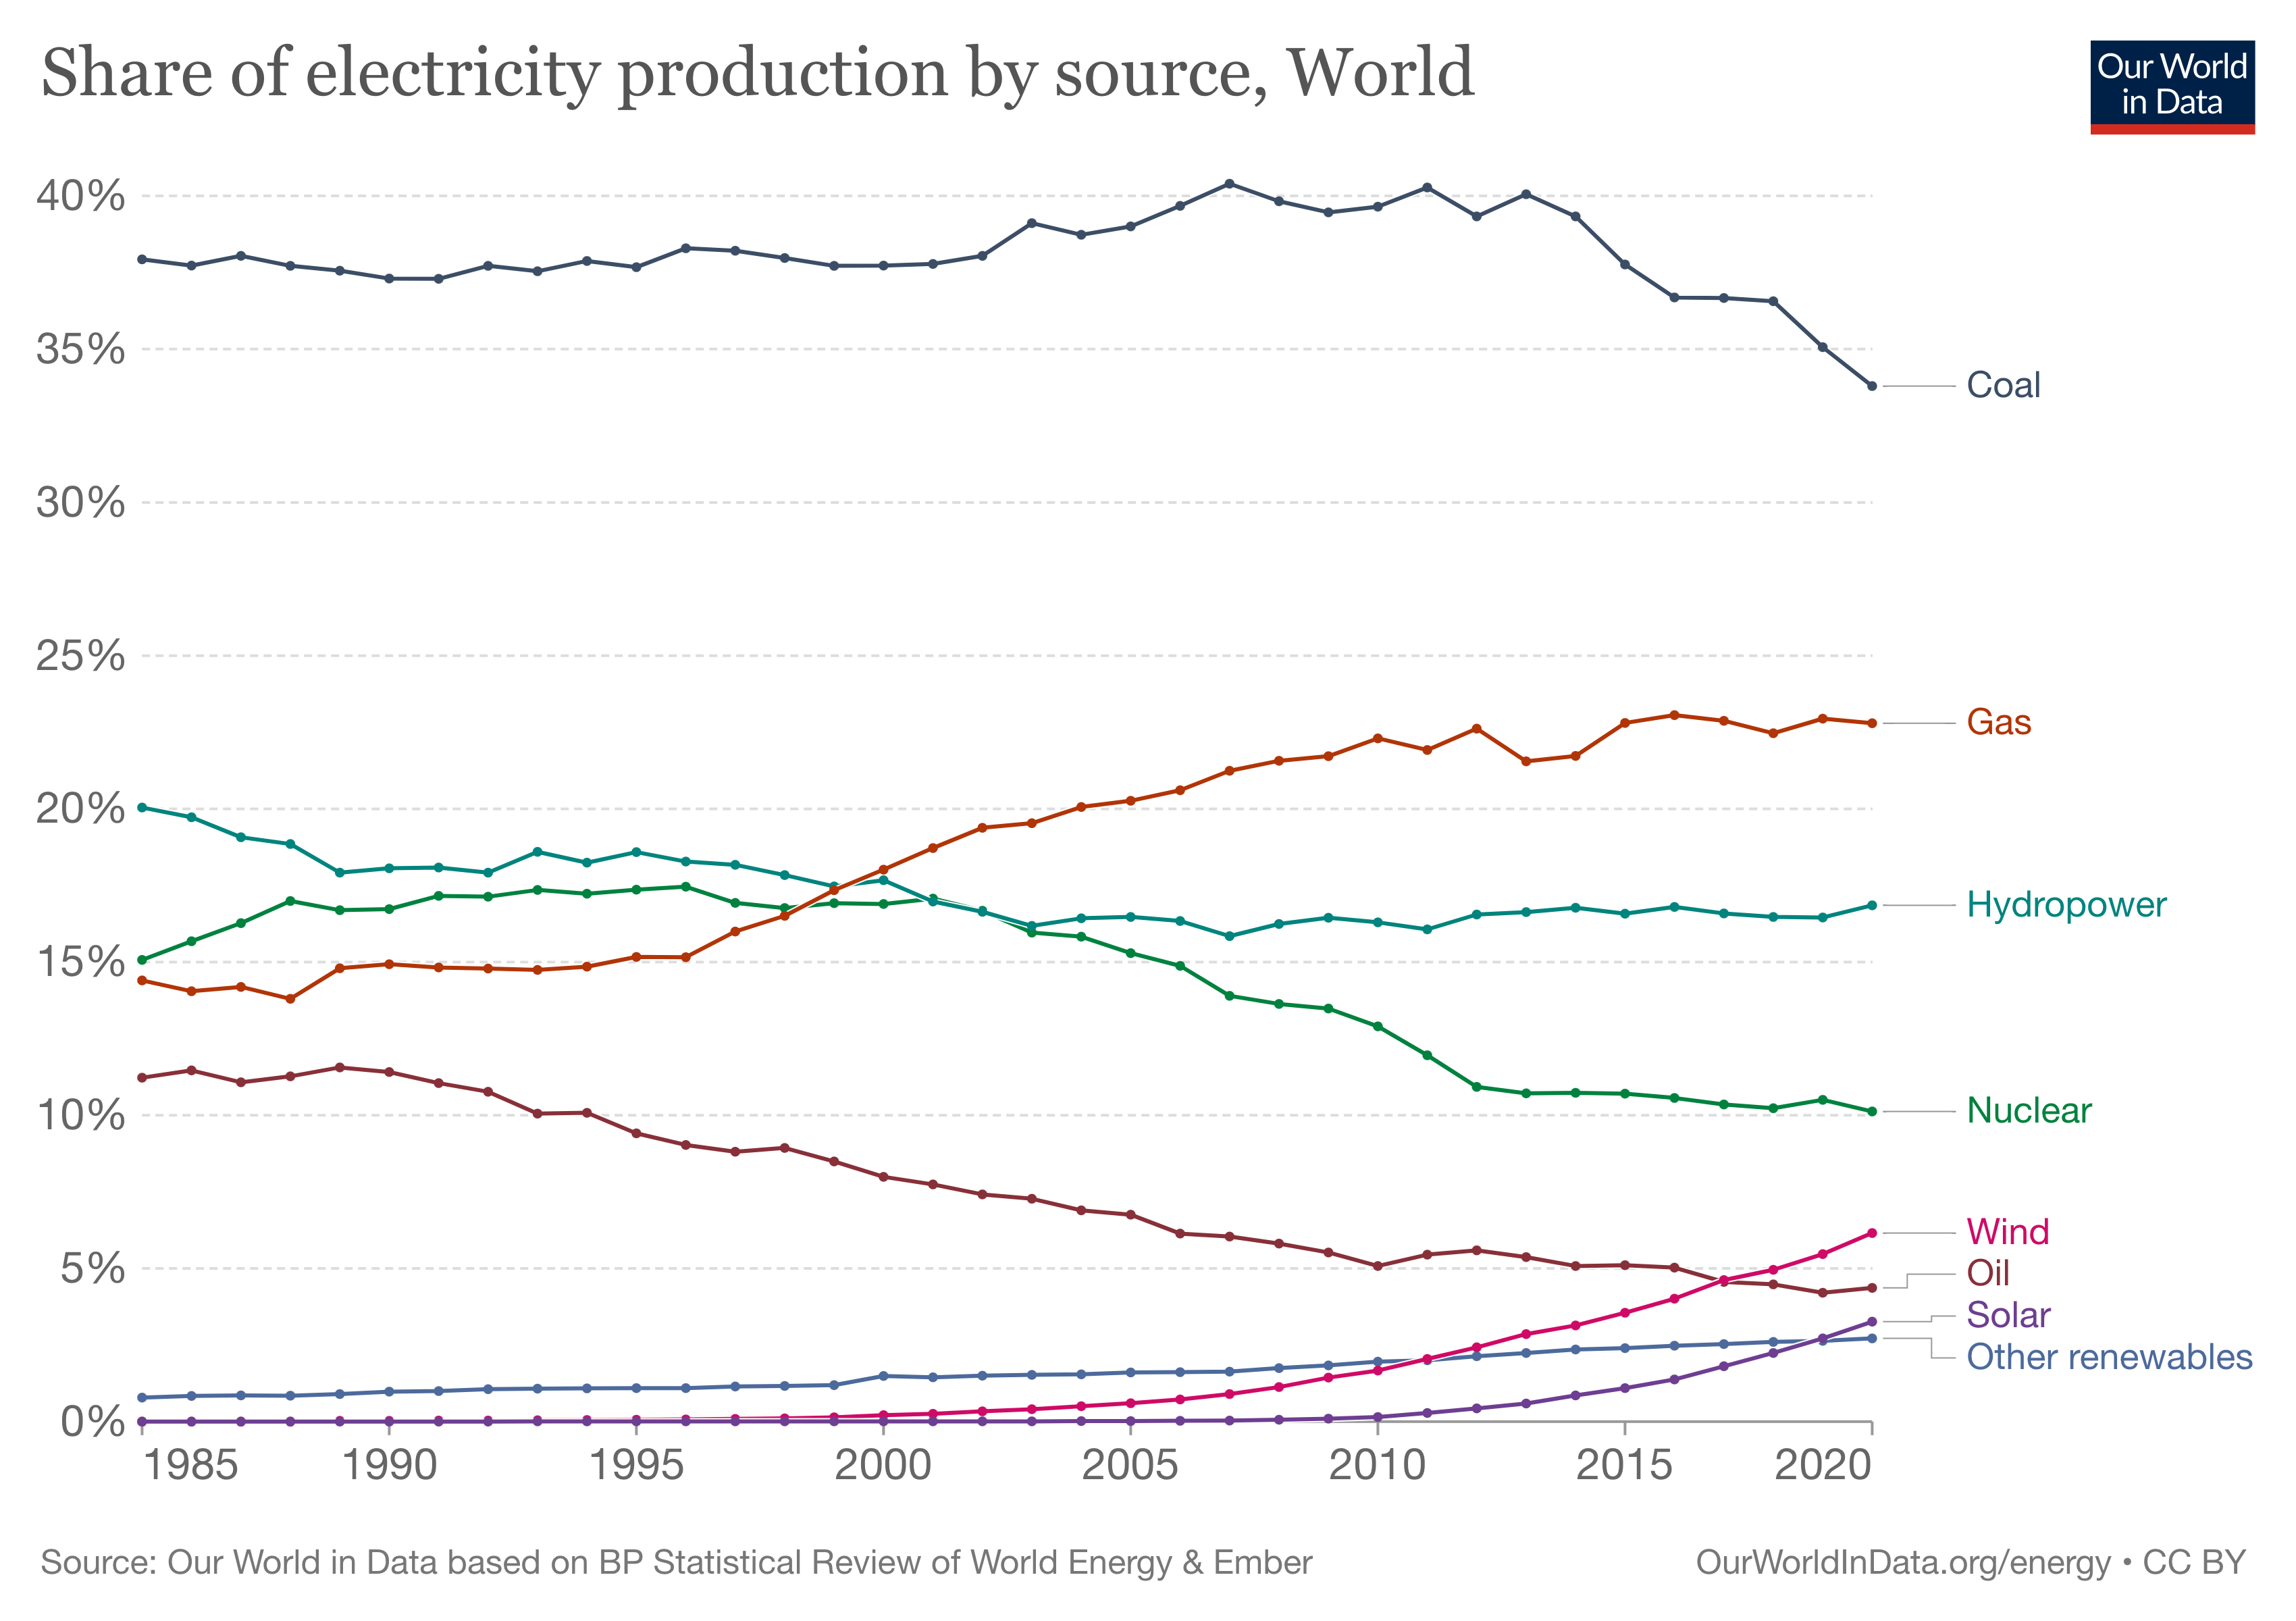
The demise of coal generation is happening at different rates around the world. The trend is led by the U.S., which has seen coal share drop from 50% to 19% over the last 15 years. This is mainly driven by the compelling economics of U.S. natural gas fracking. Europe, which does little natural gas fracking, has also seen its coal generation market share drop from 30% to 18%. European wind and solar are picking up share. China is frequently fingered as an egregious air polluter, but coal generation has dropped from 80% of their energy mix in 2007 to the present level of 60% as other generation methods rise — hydro, wind, solar, nuclear, and gas. India is also seeing less coal use, though the decline is quite modest, dropping from 76% share to 71% in the last five years, perhaps a reflection of its sizable coal reserves.
Bucking the global trend are China’s neighbors to the south — Vietnam, Cambodia, Malaysia, Indonesia, and the Philippines — where coal generation share has risen from approximately 20% of the mix in 2007 to 48% as of 2021. A big factor has been China’s Belt and Road Initiative, a global infrastructure development strategy where China is involved in some 240 coal plants across dozens of lesser developed countries. Levelized cost of electricity in these plants is likely well below the U.S. level of $112/MWh, reflecting differing construction, safety, and environmental standards. China has said publicly in 2021 that it no longer considers projects with high pollution and high energy consumption such as coal mining and coal fired power stations. While it is unlikely the new China Belt and Road coal plants will be prematurely retired, coal generation market share in the rest of the world is likely to continue to decline.
Natural gas
Unlike coal, natural gas requires a pipeline infrastructure for fuel supply needs. As a result, natural gas was a late entrant as a fuel for electricity generation. Natural gas-fired generation arrived in Europe in 1940 and in North America in 1960. Natural gas is a very compelling fuel choice. It is the lightest of the hydrocarbons, and so it burns cleaner and with fewer carbon emissions than oil or coal.
Natural gas production in the U.S. has roughly doubled in the last 20 years due to hydraulic fracturing, or fracking. The new drilling technology fractures rock using an injection of high-pressure fluids resulting in new channels in the rock which then release previously trapped gas. Fracking is controversial. Opponents worry about groundwater safety, seismic risk, methane leakage, and noise. Fracking is banned in a handful of states in the U.S. and provinces in Canada. Fracking is more pervasively banned in the European Union, including most countries of size. Fracking proponents highlight the access to significant new reserves and the ability to replace dirty coal with clean gas plants.
The fracking boom and pivot to natural gas-fired generation is mostly a U.S. phenomenon. In the past 20 years, natural gas-fired generation in the U.S. has risen from 16% of total generation to 40% today. Levelized cost of electricity in the U.S. using natural gas is a reasonable $80/MWh according to Lazard or a very compelling $45/MWh according to IEA. However, there are only a handful of countries that are seeing meaningfully increased natural gas-fired generation — Australia and Nigeria are examples. In contrast, natural gas-fired generation in Europe has barely budged from 15% of total generation twenty years ago to 19% today.
The growth of natural gas-fired electricity generation is directly related to the penetration of fracking, and fracking penetration can be low for three reasons: (1) The country may ban fracking like most countries in the European Union; (2) The country may have little or no natural gas reserves like Singapore; or (3) The country may have an overabundance of natural gas, which limits the usefulness of fracking technology like Qatar.
Natural gas-fired generation may continue to gradually increase its share of the energy mix at the expense of coal-based generation, but further increases are not likely to emanate from the U.S. or Europe. The China Belt and Road coal plants may eventually be candidates for replacement by natural gas-fired generation, but given the young age of these coal plants, such a pivot is not imminent. Natural gas-fired generation may see pressure from environmental groups looking to eliminate all hydrocarbons as fuel sources. In the last few years, state-based hydrocarbon-elimination proposals in California and New York have been in discussion, though no formal regulation/legislation has happened at this point.
Hydropower
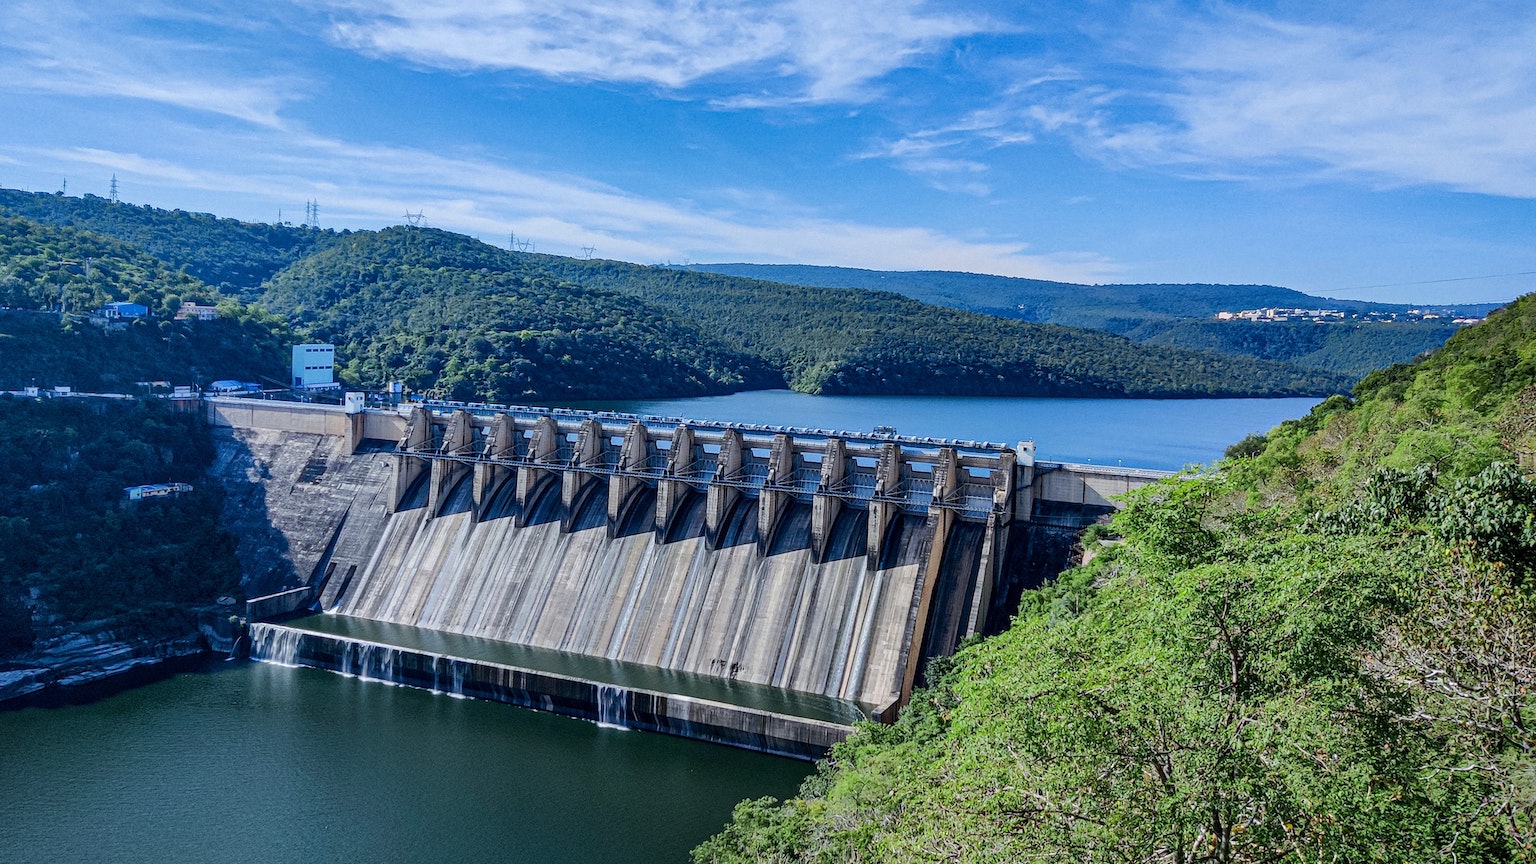
Harnessing the power of water is an ancient tradition. Humans used water wheels to mill wheat, polish stone, and cut wood. For electricity generation, hydropower and coal power are of the same vintage, dating to about 1880. Hydropower saw its most significant gains in the U.S. amid the depression-era government dam-building period, as a reaction to the collapse of the utility holding companies.
Hydropower seems to have a lot to offer: no carbon emissions, no radioactive waste, completely renewable, and it can “store electricity” as water behind the dam. But these benefits come with offsetting costs. Dams can displace people from their homes and flood sites of historic importance. Environmental impact is severe, affecting fish populations and migration patterns as well as the plants and animals in the river watershed. Dams can trigger landslides and earthquakes. In most mature economies, new dam construction is simply not happening. The environmental effects are just too significant. However, once dams are built, the damage becomes a largely irreversible sunk cost, so they do not come down. The benefits are too profound to relinquish. Dams are like nails without heads — once they go in, they never come out.
Levelized cost of electricity for hydropower is not readily available for North America, given that there have been no new dams in years. Still, the Energy Information Agency (EIA) has rough estimates at about half-way between the cheap LCOE of gas-fired generation and the more expensive LCOE of coal-fired generation. Hydropower has no fuel cost, so the bulk of the LCOE is in the upfront construction cost and not the operating cost. LCOE outside North America is likely lower, especially in regions like China where new dams are under construction.
U.S. hydropower generation is only 7% of the total US energy mix, a figure that has been unchanged for several decades. European hydropower generation is 16% of the mix, also unchanged for several decades. Hydropower in Canada is comparatively high at 60% of the mix, but again, unchanged in recent decades. In the last 20 years, most of the new hydropower construction worldwide has been in China. This includes the high profile Three Gorges Dam (the world’s largest power station generating 22,500 MW and completed in 2012) and at least two dozen other new, large dams. Despite all this new investment, hydropower remains at 18% of the Chinese generation mix, mostly unchanged from a decade ago as other forms of power in China also grow at a fast clip. There are few countries where hydropower is increasing its share of the electricity generation mix or decreasing its share of the generation mix, a trend that seems likely to continue.
Nuclear
The on-off experience with nuclear power in America in the prior 60 years is not uniformly shared with the rest of the world. At a broad level, nuclear power has seen very modest losses in its share of the world energy mix in the last several decades. Nuclear power is about 20% of electricity generation in the U.S. and about 10% worldwide. The 2011 Fukushima Daiichi nuclear power disaster in Japan accelerated the apparent demise of nuclear power worldwide, though most of the nuclear power plant shutdowns were in only two countries, Japan and Germany. And in recent years, those shutdowns have been offset by new nuclear power plants in China, Russia, India, and South Korea. The draw to nuclear power outside the west is its zero-carbon footprint, a very high energy density, and a more reasonable levelized cost of electricity.
Nuclear power does not involve burning hydrocarbons and so electricity generation does not release carbon into the atmosphere. But this does not mean nuclear power is environmentally friendly. Nuclear waste is radioactive. It takes 1,000 to 10,000 years for the radioactivity of high-level waste to return to that of the originally mined ore. By comparison, excess carbon in the atmosphere takes 300-1,000 years to dissipate. Nuclear accidents like Three Mile Island, Chernobyl, and Fukushima also pose a risk to the environment, though the overall nuclear power safety record is still comparatively good being above that of coal and natural gas generation. Nuclear power, like any form of generation, involves trade-offs.
Published estimates of levelized cost of electricity for nuclear power are typically high, though there is a wide variance between the Lazard figures and the IEA figures. Again, LCOE is a tough calculation with much variability over time and across jurisdictions. America has only one nuclear power plant under construction at present (Vogtle Units 3 & 4). The construction cost is expected to be approximately $28 billion at completion in 2022 for roughly 2,400 MW of generation capacity, or $11,670 per kW of generation. That is expensive. Vogtle is over twice the price per kW as Tennessee Valley’s Watts Barr nuclear power station, which just came online in 2016 at a mere $4,000/kW. And Watts Bar is about 50% more expensive than average capital cost of nuclear power in Asia at only $2,600/kW.
Why is nuclear power so expensive in America and at Vogtle in particular? Nuclear power proponents are frequently critical of America’s nuclear industry, which suffers from a lack of standardization. Countries with larger nuclear industries, such as France and South Korea, tend to coalesce around standard designs and operating procedures which increase economies of scale and allow a common learning platform. The Korea Standard Nuclear Plant (KSNP) has a persistent downward cost curve with each new nuclear power plant, much like what the world is seeing today with solar and wind power. This is the opposite experience of U.S. nuclear power, where each new plant seems to require significant reinvention and re-engineering.
Regulatory rules and expectations are likely another factor lifting costs in the U.S. Utilities are paid on cost reimbursement, so there is an active disincentive to reduce costs on the part of utility leadership. Regulators are tasked with the burden of minimizing levelized cost of electricity within the constraints of the six criteria for success — safety, reliability, resiliency, sustainability, accessibility, and affordability. However, there is less room for budgetary negotiation and alternatives when the regulators’ employer (i.e., typically a Governor, or President Obama in the case of Vogtle) commits to a choice with a high LCOE, real or perceived. Cost overruns should be expected. This will increase the LCOE, real and perceived, for future nuclear power projects, a spiral that is difficult to reverse.
From here, it seems more of the same is in order, with the nuclear industry in the West neither growing nor shrinking much. While there are a handful of interesting new technologies with smaller footprints and 3rd/4th generation designs, it seems unlikely these technologies will see wide acceptance without a catalyst to overcome the chicken-or-egg economy-of-scale problem endemic to the industry. Outside the West, the nuclear fleet will likely continue to grow due to lower levelized costs, the most energy-dense form of electricity generation, and a compelling zero-carbon footprint.
Wind
Wind power got off to a rough start in California in the 1980s, but the subsequent generations of wind power and improvements in technology have been impressive. Modern windmills dwarf the size of the prototype windmills of the 1980s. The present record holder is the GE Haliade-X windmill in the Netherlands, which stands a full 850 feet tall from base to the top blades. However, the GE record may soon be eclipsed by Denmark’s Vestas V236 windmill, which could top 1000 feet. These are very different machines from the scores of 30-50 footers that spread across the Altamont in the 1980s.
Windmill improvements over the last 30-40 years go well beyond size. Blade materials have improved to address stability, rigidity, weight, and durability. Turbine generators and electronics have improved to address challenges with rectifiers and inverters. Today, nameplate capacities on new windmills average 2.0-2.5 MW with many of the larger windmills over 10 MW. This is a sizable increase from the average nameplate capacity of 0.1 MW in the 1980s. The technology and scale improvements have dropped levelized cost of wind power through the floor.
At $40/MWh, wind power today has one of the lowest LCOEs of any utility scale form of electricity generation. Levelized costs vary by geography and jurisdiction. For example, the Wind Belt of America — which runs in a straight line north from the center of Texas through North Dakota and into Saskatchewan — has significant potential for low-cost wind generation as well as available land for wind farms. Tax incentives and preferential dispatching clearly played a role in the early growth of wind power, not just in California but also in certain European countries like Germany and Spain. However, windmills today are being installed all over the world. This is an encouraging sign that LCOE is in fact low due to improved technology and scale and without tax and regulatory factors muddying the water. The country with the most installed wind capacity worldwide is China, followed by the U.S., Germany, and India.
While the evolution of windmill technology is inspirational, every form of generation involves trade-offs, including wind power. The biggest challenge with wind power (and its renewable cousin solar power) is intermittency. If the wind does not blow, there is no electricity generation. Since there is no way to store wind power for later use like water behind the dam, calm windless days can be problematic for the hospital or the school or other utility customers that need a reliable and uninterrupted supply of electricity. The intermittency issue relegates wind power to a second-tier role in the energy mix, a downgrade from the first tier of baseload power. New wind power capacity is typically accompanied by additional baseload power, in the event the intermittent power proves unreliable. The additional just-in-case backup power is not often factored into wind power LCOE calculations. Lastly, wind power does not have the sought-after high energy density of nuclear or coal-based generation. Wind farms take up a lot of land area, which is often far from urban centers, which means even more land area is required for transmission and distribution.
While wind power may not be a panacea for climate change, wind power does offer a compelling, low cost, renewable solution that will be an increasing part of the world energy mix. While there is a limit to how much intermittent power the grid can take, most of the world is nowhere near that limit. Indeed, gusty Denmark now generates 56% of its power from the wind, nearly 10-fold higher than the rest of the world, which generates a mere 6% from wind. This is an inspirational vision of future potential.
Solar
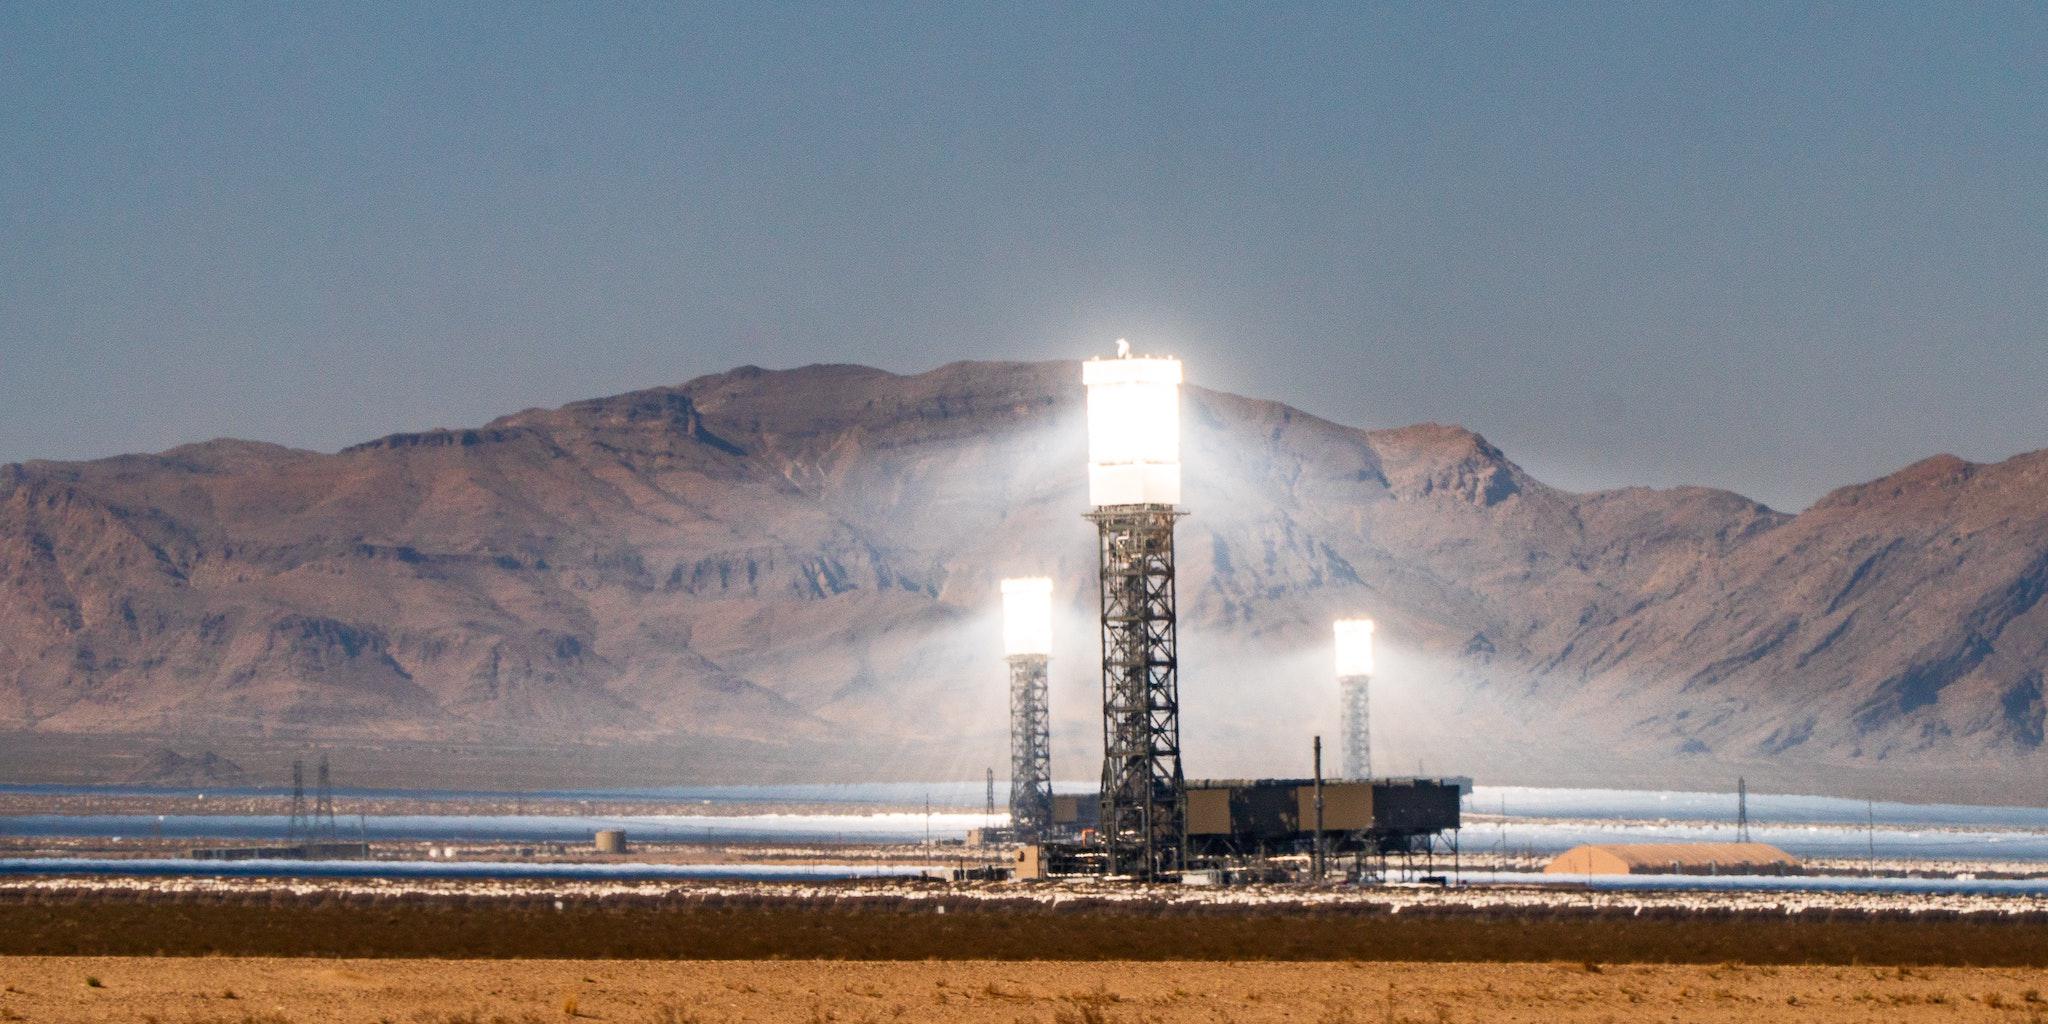
Solar photovoltaic (PV) power is an encouraging tale of virtually carbon-free electricity production, technology innovation, and economies of scale, with cost dropping nearly every year for the last 25 years. Solar module costs declined nearly 90% from just a decade ago, and today, solar PV has the lowest levelized cost of electricity of any utility-scale electricity generation at only $37/MWh, according to Lazard.
Demand in the early 2000s was initially driven largely by very generous subsidies mainly in Germany and Spain. This was accompanied by massive investment by the Chinese government in solar production capacity which reduced unit cost of production through economies of scale. In the 2010s, the lower cost solar modules spread beyond Germany and Spain to other countries (despite a controversial 2009 reversal of an overly generous feed-in tariff which stalled new solar in Spain in the 2010s). The broadening of the solar footprint resulted in further reductions in Chinese unit costs. Advancing technology also played a role: higher solar cell efficiencies and trackers to follow the sun, along with net metering and improved feed-in tariffs.
Today, the world’s largest solar park is in Bhadla, India with an installed capacity of 2,245 MW, an impressive figure that is roughly in line with many non-renewable power plants (gas, coal, and nuclear). Seven of the top 20 largest solar installations are in India, though solar currently constitutes only 5% of India’s electricity generation at present. Other countries with large solar installations are in sunny Egypt, United Arab Emirates, Mexico, China, and the U.S. southwest, though like with India, solar still only constitutes a small 2%-5% of electricity generation. Australia, Germany, and Spain lead the world in solar as a percent of their total energy mix with each at approximately 9%-10% share.
The inspirational story of solar PV comes with caveats. As with wind power, the biggest weakness of solar PV is intermittency. If the sun does not shine, there is no electricity generation, which is a problem for sensitive loads like the semiconductor clean room. So, solar power is not an option as first tier baseload power, especially in cloudy northern climates. Since there is no way to store solar power and no utility scale batteries, any installation of solar power must be accompanied by additional just-in-case baseload power, an expense that is not factored into solar LCOE calculations. Also, the compelling headline LCOE figures only address utility scale solar PV. The LCOE for residential rooftop solar PV is presently about five-fold the LCOE for utility scale solar PV, according to Lazard, which is not compelling at present, though the figures are clearly improving as new installations accelerate. Lastly, as with wind power, solar has low energy density — solar farms require acreage, which is typically many miles from urban loads.
Despite the caveats, the rise of solar PV shows no signs of slowing. The installed base of solar PV is still quite small with solar PV constituting only 3% of global electricity generation. Yet growth in solar PV generation is happening in dozens of countries and on all continents. As with wind power, there is a theoretical cap on how much intermittent solar PV can contribute to the energy mix, but the world seems to be nowhere near that cap. More solar PV seems likely to be forthcoming.
Oil and geothermal
Oil is mainly used as a source of energy for transportation and is less common as a fuel for electricity generation. However, oil is still used as a primary fuel source for electricity generation in island locations such as Hawaii, since such islands generally have little in the way of native fossil fuel resources. Oil is easier and cheaper to ship (per unit of energy content) than coal or natural gas. Oil is also occasionally used as a back-up fuel in remote regions since it is easier to store than natural gas. Oil will likely continue to be a niche fuel for electricity generation.
Geothermal is compelling from a sustainability standpoint with little to no emissions or waste. However, drilling costs are expensive, accounting for over 50% of total capital costs. Further, there are limited sites for development. Geothermal energy seems likely to remain a niche source of energy for electricity generation.
This article was adapted from an essay written by Paul Latta, which is now archived at Suzzallo Library’s Special Collections at the University of Washington.
