How Many Years of Your Life Will Your House Cost You?

Anyone graduating from pocket money to their first real pay check will know the feeling: I’m rich! Luxuriate in that sentiment, because it will well and truly end when you start looking to buy a place of your own.
Budding cartographer John Nelson found that even the cheapest houses in the area where he found work would cost him, as expressed in annual income, ten years of his life.
“Of course that’s not how mortgages actually work. It’s much worse than that”, he writes in a wryly funny piece, exploring the wide range in the accessibility of home ownership across the length and breadth of the U.S. Expanding on the (overly optimistic) annual salary/house price comparison, he found that “the typical ratio of median home value to the median income is 1:3”.
On this map, the counties where that rule of thumb applies are blank. In counties shaded green, median house prices are lower (lowest in the darkest-green ones). Purple counties have higher median house prices (at least 10 times the median income in the darkest ones).

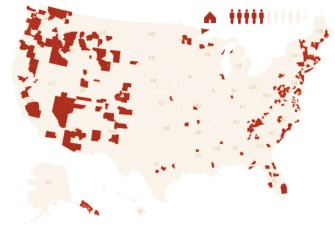
To get a more detailed look at the geographic spread, Mr. Nelson then sliced his results into several bands of home affordability, as expressed in annual income.
Crockett and Upton Counties in Texas are the only two counties in the entire country where the local median home values ($49k and $53k; respectively) are lower than the local median annual incomes ($52k and $56k).

Leaving some exceptions, mainly in the east (and mainly in Illinois) to one side, the band where a house equals two salaries looks like a copy of the Wheat Belt, splitting the country right down the middle.

One house equals three annual incomes: this is the norm in most of the country, but most distinctively so in the Midwest and the South. If you like to live near wide expanses of water, head towards the Gulf coast in Texas or Louisiana, or get thee to the Great Lakes. Or, if you don’t mind the cold, Alaska. The northern bits.

Four annual incomes will get you a seaside house along much of the Eastern Seaboard. Most of the West Coast is still out of your price range, though. Unless you (generously) include southern Alaska in that definition.

If you want to spend five years of your life/income on a house, you get the other half of the Eastern Seaboard, or you inch a bit closer to the Pacific. Southern Nevada and southern Arizona are some of your alternatives.

Six annual incomes? That earns you a house in large swathes of the Pacific states, though in most cases still not near the beach. Further inland, big chunks of Arizona, Colorado and Idaho fall into your price range. As do smaller, urban areas in the east. And Big Island in Hawaii.

For seven times your annual income, you get even choicer bits of Colorado and Idaho, plus you’re edging ever closer to the Pacific in California. That single red dot in North Carolina looks like it’s Watauga county. Also in this segment: a few counties around New York City, and Barnstable County, virtually coterminous with the Cape Cod peninsula.

You can be beside the seaside in large areas along the California coast, in selected urban areas back east, in (what looks like) Montrose and Delta Counties in southwest Colorado, and on the westernmost islands of Hawaii. It’ll only set you back eight times your annual salary.

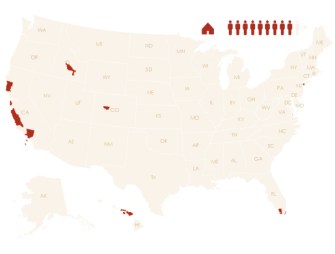
Willing to pay nine times your annual income for a house? Then you can live along even nicer bits of California’s coast. Or in Queens, the middle islands of Hawaii and Miami Beach, among a few other places.

Got even more income to spend? In these pockets of home (un)affordability, a house will set you back at least 10 times your annual income. The biggest splash of red is Teton county, which includes Yellowstone and the resort of Jackson Hole. Barely visible is San Juan Island, across from Seattle. Two other small red dots (in familiar places) are San Francisco and New York City.

That red dot off the coast of Massachusetts is Dukes county, which contains pricey Martha’s Vineyard, which is where Mr. Nelson fell into the gap between income and house affordability about a decade and a half ago. He and his family now live “in a rickety old wooden farm house in the Midwest”.
Maps found here on John Nelson’s blog, Adventures in Mapping. The article contains an animated version of the maps shown above.
Got a strange map? Let me know at strangemaps@gmail.com.
Strange Maps #862


