
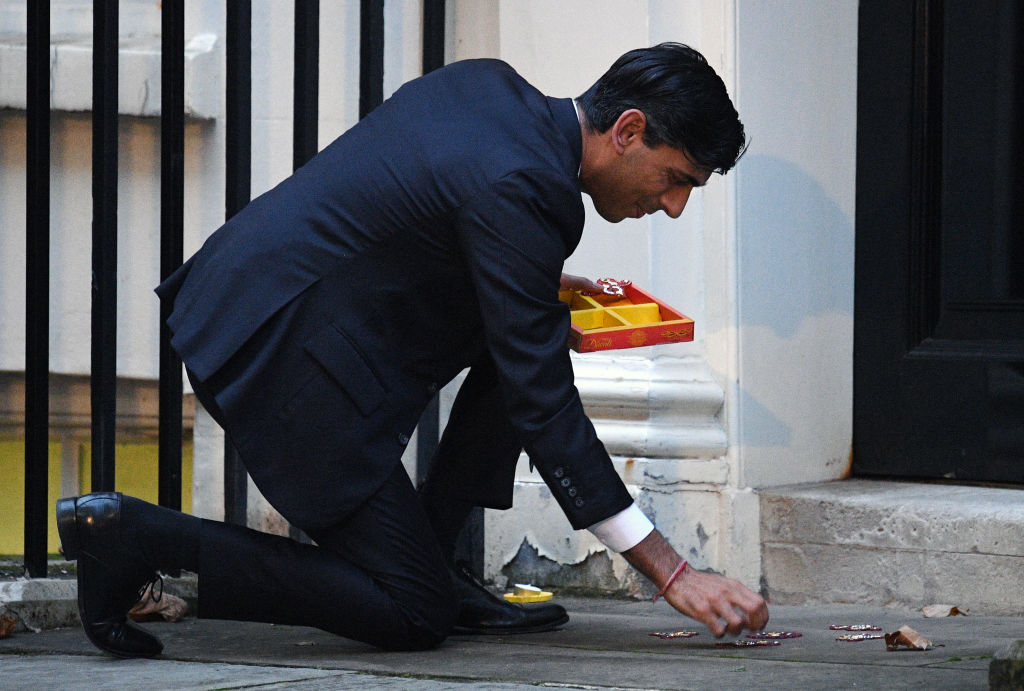
October 25, 2022 has been called Britain’s “ Obama Moment”: On that day, Rishi Sunak became the country’s first ever non-white Prime Minister. But Britain’s current head of government represents an even bigger change. As a practicing Hindu, Sunak also is Britain’s first non-Christian PM. And although Sunak won his post via an internal poll among Conservative Party Members of Parliament rather than a general election, on that last point at least his tenure is timely and symbolic.
Because, as confirmed by the recently published results of the 2021 census, England is — for the first time in more than almost 1500 years — no longer a majority Christian country. The big winner is not any other religion, but “no religion.” This is, in other words, also England’s “Dover Beach” moment, when the Sea of Faith retreats in a “melancholy, long, withdrawing roar.”
In late November, the UK’s Office for National Statistics published results for the religion question from the census (which covers both England and Wales, but not Scotland or Northern Ireland). The ONS website also offers the results in the form of an interactive map, allowing for a cartographic exploration of the latest religious statistics for England and Wales.
Christianity is in an accelerated decline
- In the 2001 census, the first time people were asked about their religion, 71.7% (37.3 million) of people in England and Wales described themselves as “Christian.”
- In 2011, that share had dropped 12.4 percentage points (p.p.) to 59.3% (33.3 million).
- The latest figures show that decline accelerating slightly: down 13.1 p.p. to 46.2% (27.5 million). This is the biggest decline of any response to this question in the 2021 census.
The “Nones”: The mirrored rise of “no religion”
- The decline of Christianity is mirrored by the rise of “no religion.” In 2001, this was the chosen response of only 14.8% (7.7 million).
- By 2011, “no religion” was up 10.4 p.p. to 25.2% (14.1 million).
- The latest figures put it at 37.2% (22.2 million), up another 12 p.p. — the biggest increase of any response to this question in the 2021 census.
No Christian plurality in Wales
- It’s the first time since the question was asked that “Christian” is no longer the majority answer.
- Christianity does retain its overall plurality among religions, meaning it remains the largest religious group, both in England (46.3%) and in Wales (43.6%).
- However, in Wales — where both the decline of “Christian” and the rise of “no religion” were more pronounced than in England — the latter response now holds the plurality (46.5%).
Most Christian and least religious
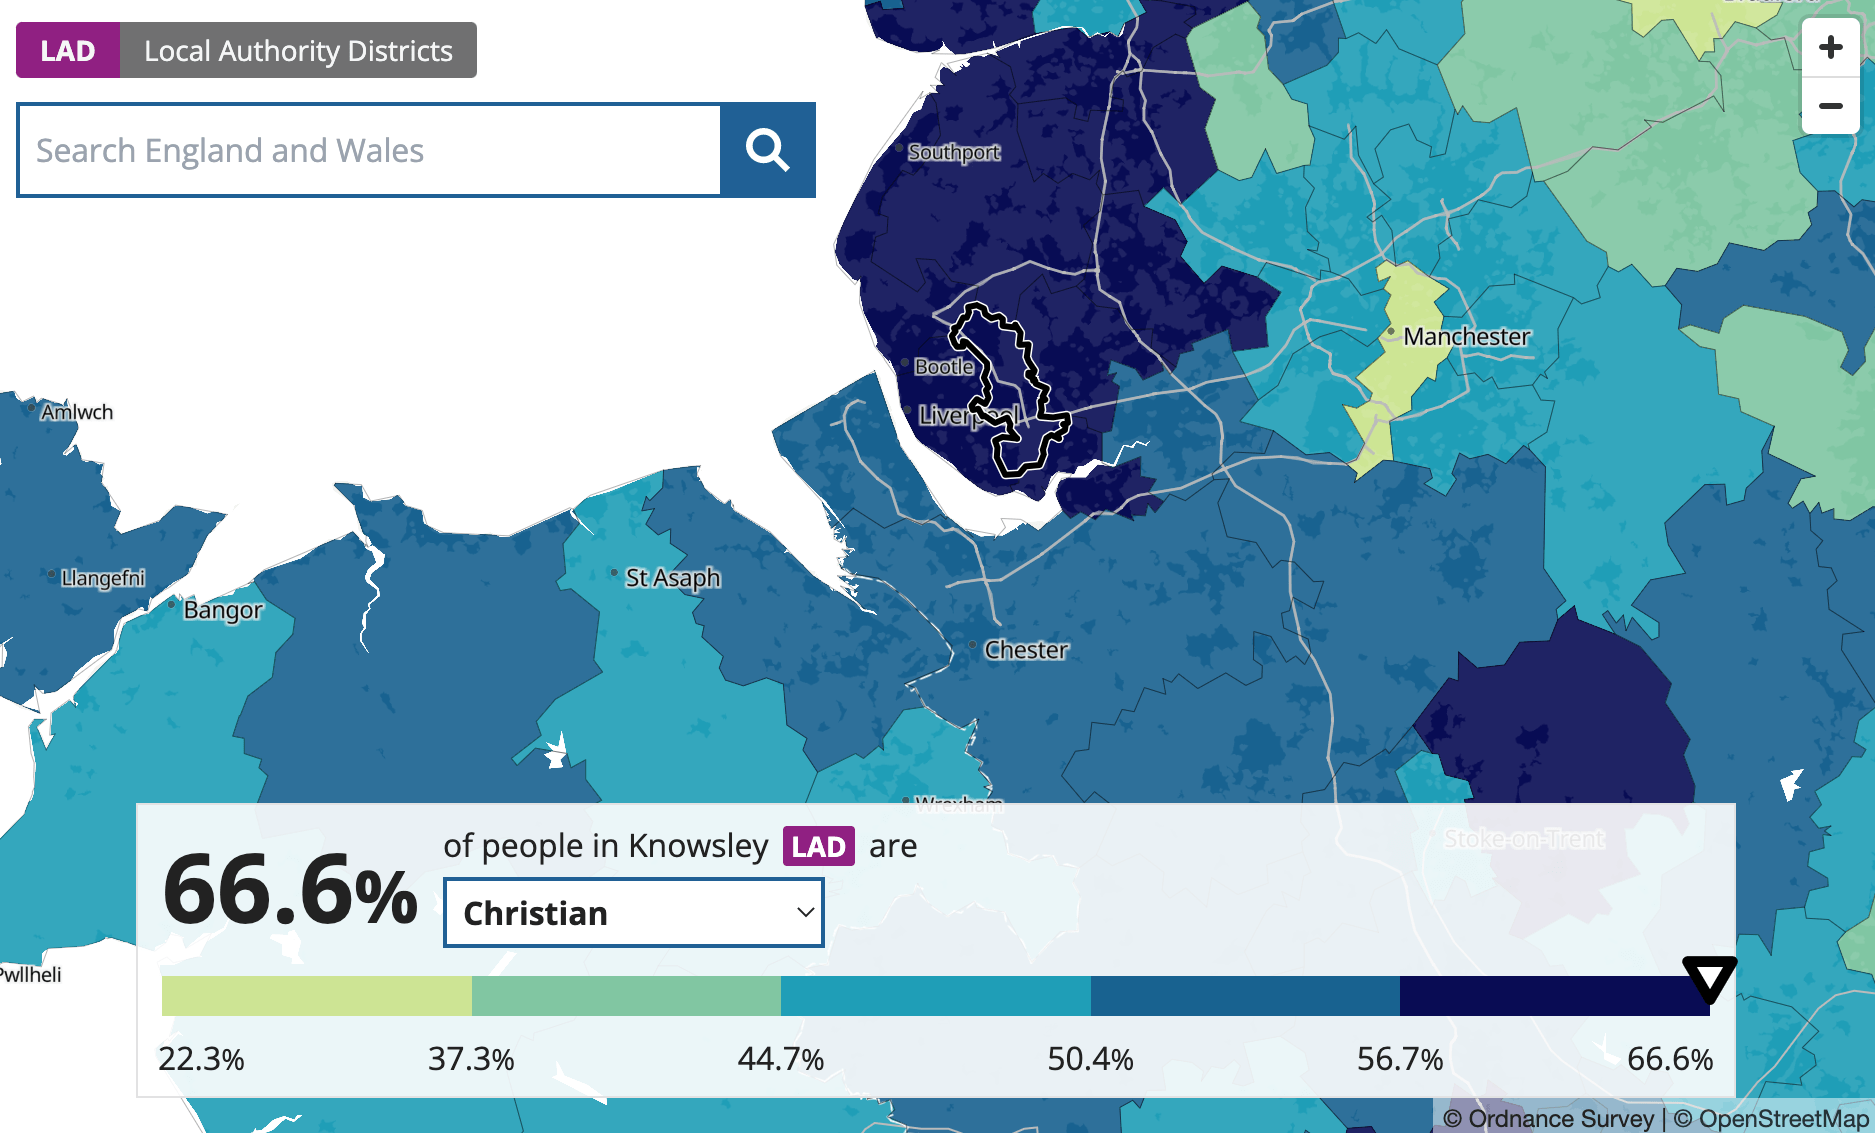
- England’s Christian heartland is in the northwest, with around two-thirds reporting “Christian” in the Knowsley (66.6%), Ribble Valley (66.4%), and Copeland (65.1%) local authorities.
- Wales’ most Christian local authorities are a lot less so: the Isle of Anglesey and Flintshire are only barely majority Christian (both 51.5%).
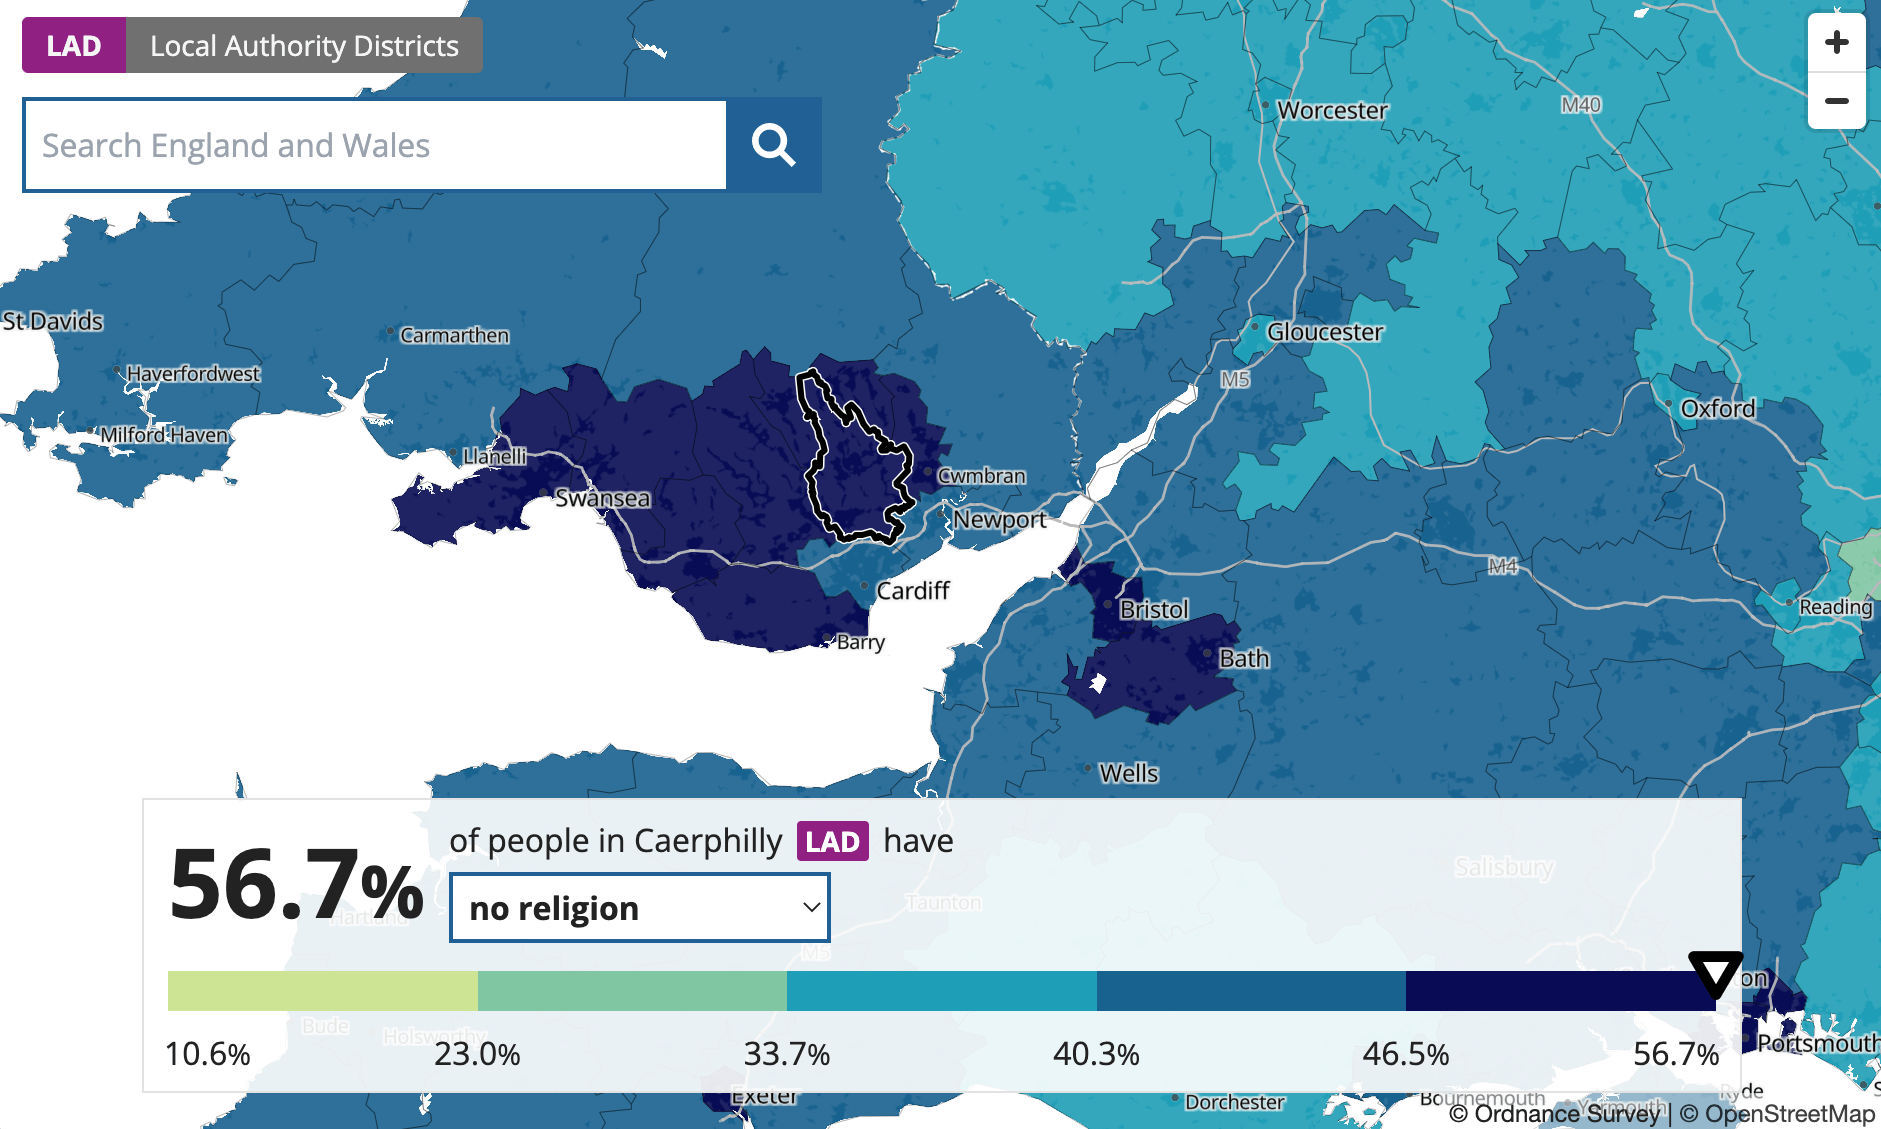
- The three least religious areas of England and Wales (i.e., the areas where most people report “no religion”) are all in Wales: Caerphilly (56.7%), Blaenau Gwent (56.4%), and Rhondda Cynon Taf (56.2%).
- The least religious area in England was Brighton and Hove (55.2%).
- Even Knowsley follows the national trend: “No religion” is up from 12.6% in 2011 to 27.2% in 2021, with “Christian” correspondingly dropping 14.3 p.p. from 80.9% in 2011.
Other major religions
- Two responses showed a marked increase: those who said they were “Muslim,” from 4.9% to 6.5% (2.7 million to 3.9 million); and
- People saying they were “Hindu,” from 1.5% to 1.7% (818K to 1 million).
- The highest percentage of those describing themselves as “Sikh” was found in Wolverhampton (12%, up from 9.1%), in the West Midlands.
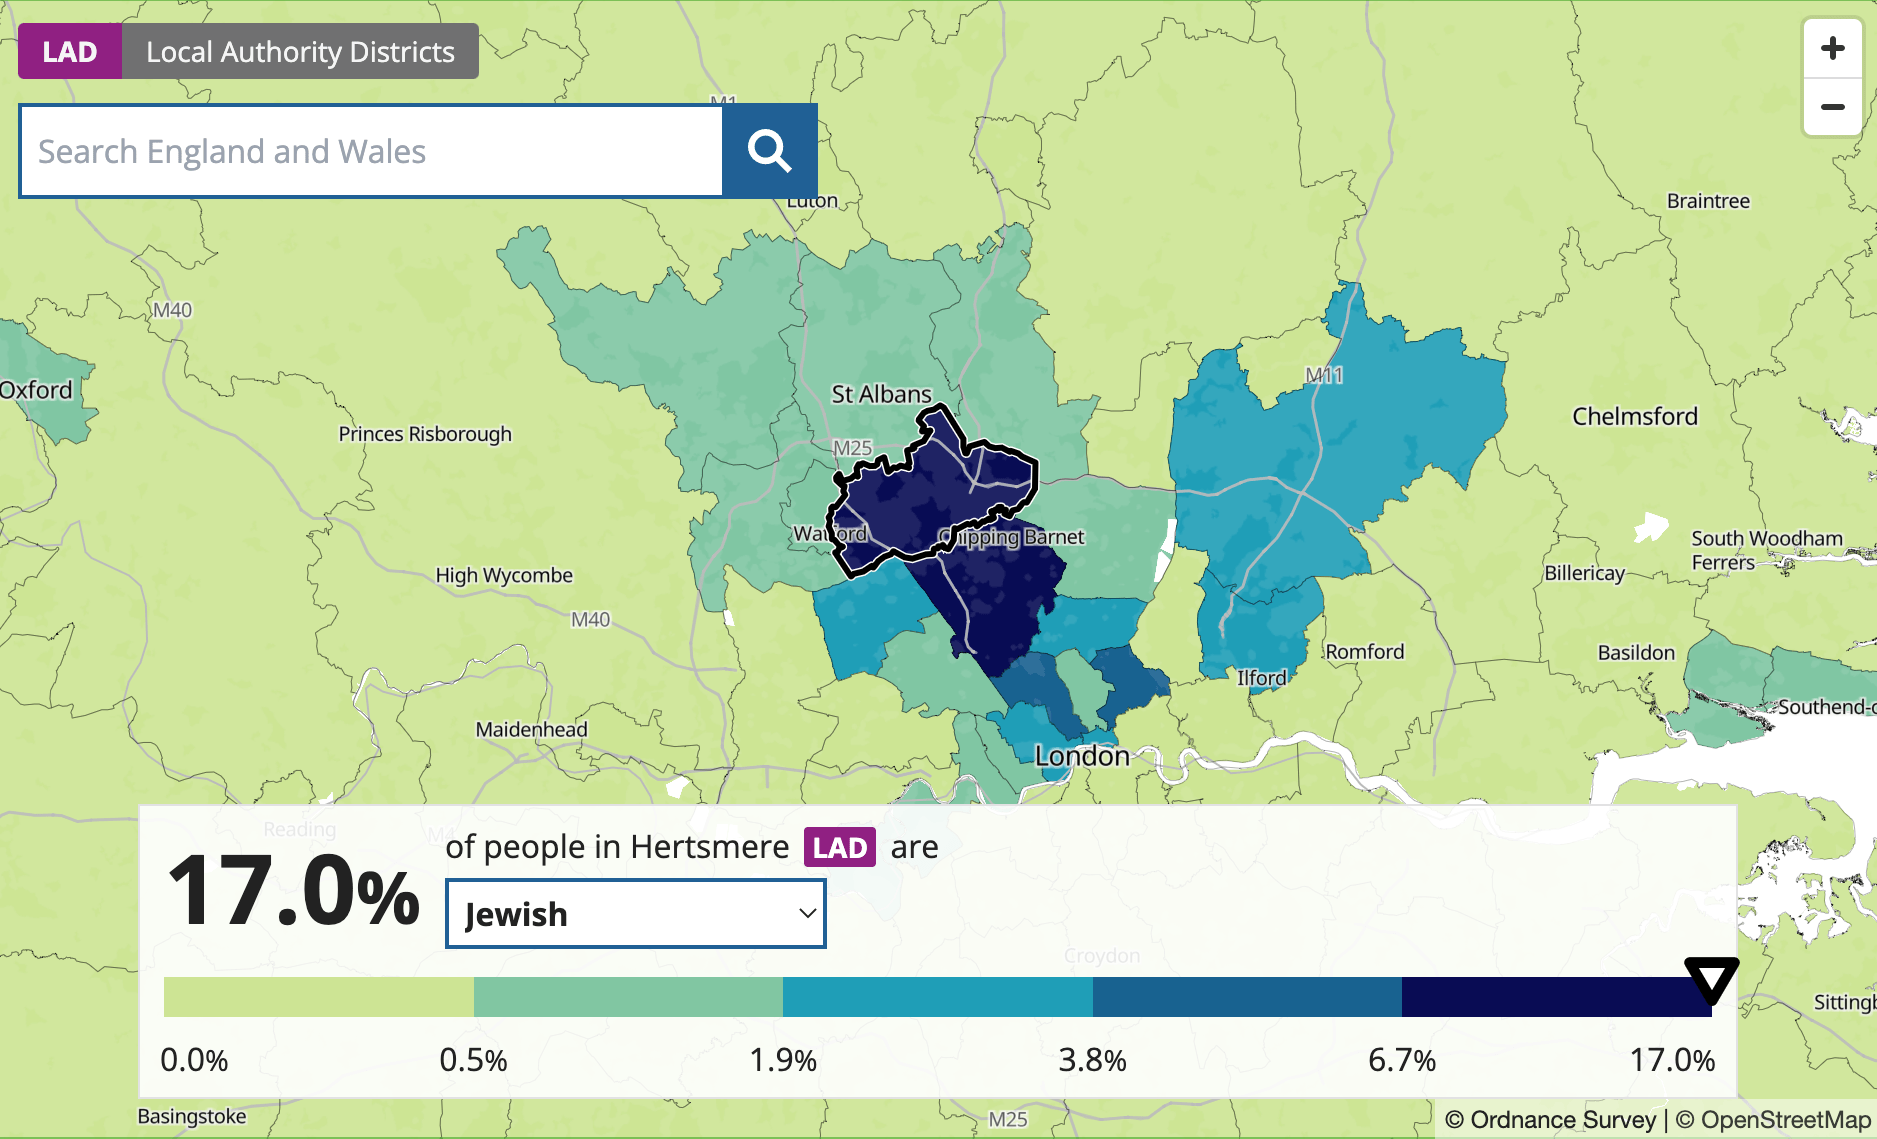
- “Jewish” was most replied in Hertsmere (17%), just north of London.
- The highest share of “Buddhist” responses was collected in Rushmoor (4.7%), in the northeast of Hampshire.
Minor (non) religions
- Around 405,000 respondents (0.7% of the overall population) chose to write in a religion — producing detailed stats on no less than 58 religious groups.
- These included, in descending order of popularity: Pagan (74k), Alevi (26k), Jain (25k), Wicca (13k), Ravidassia (10k), Shaman (8k), Rastafarian (6k), and Zoroastrian (4k).
- The strongest grower was Shamanism, increasing tenfold from just 650 in 2011.
- The “any other religion” option was also used to include a few specifically non-religious replies: agnostic (32k), atheist (14k), and humanist (10k).
Special case: London
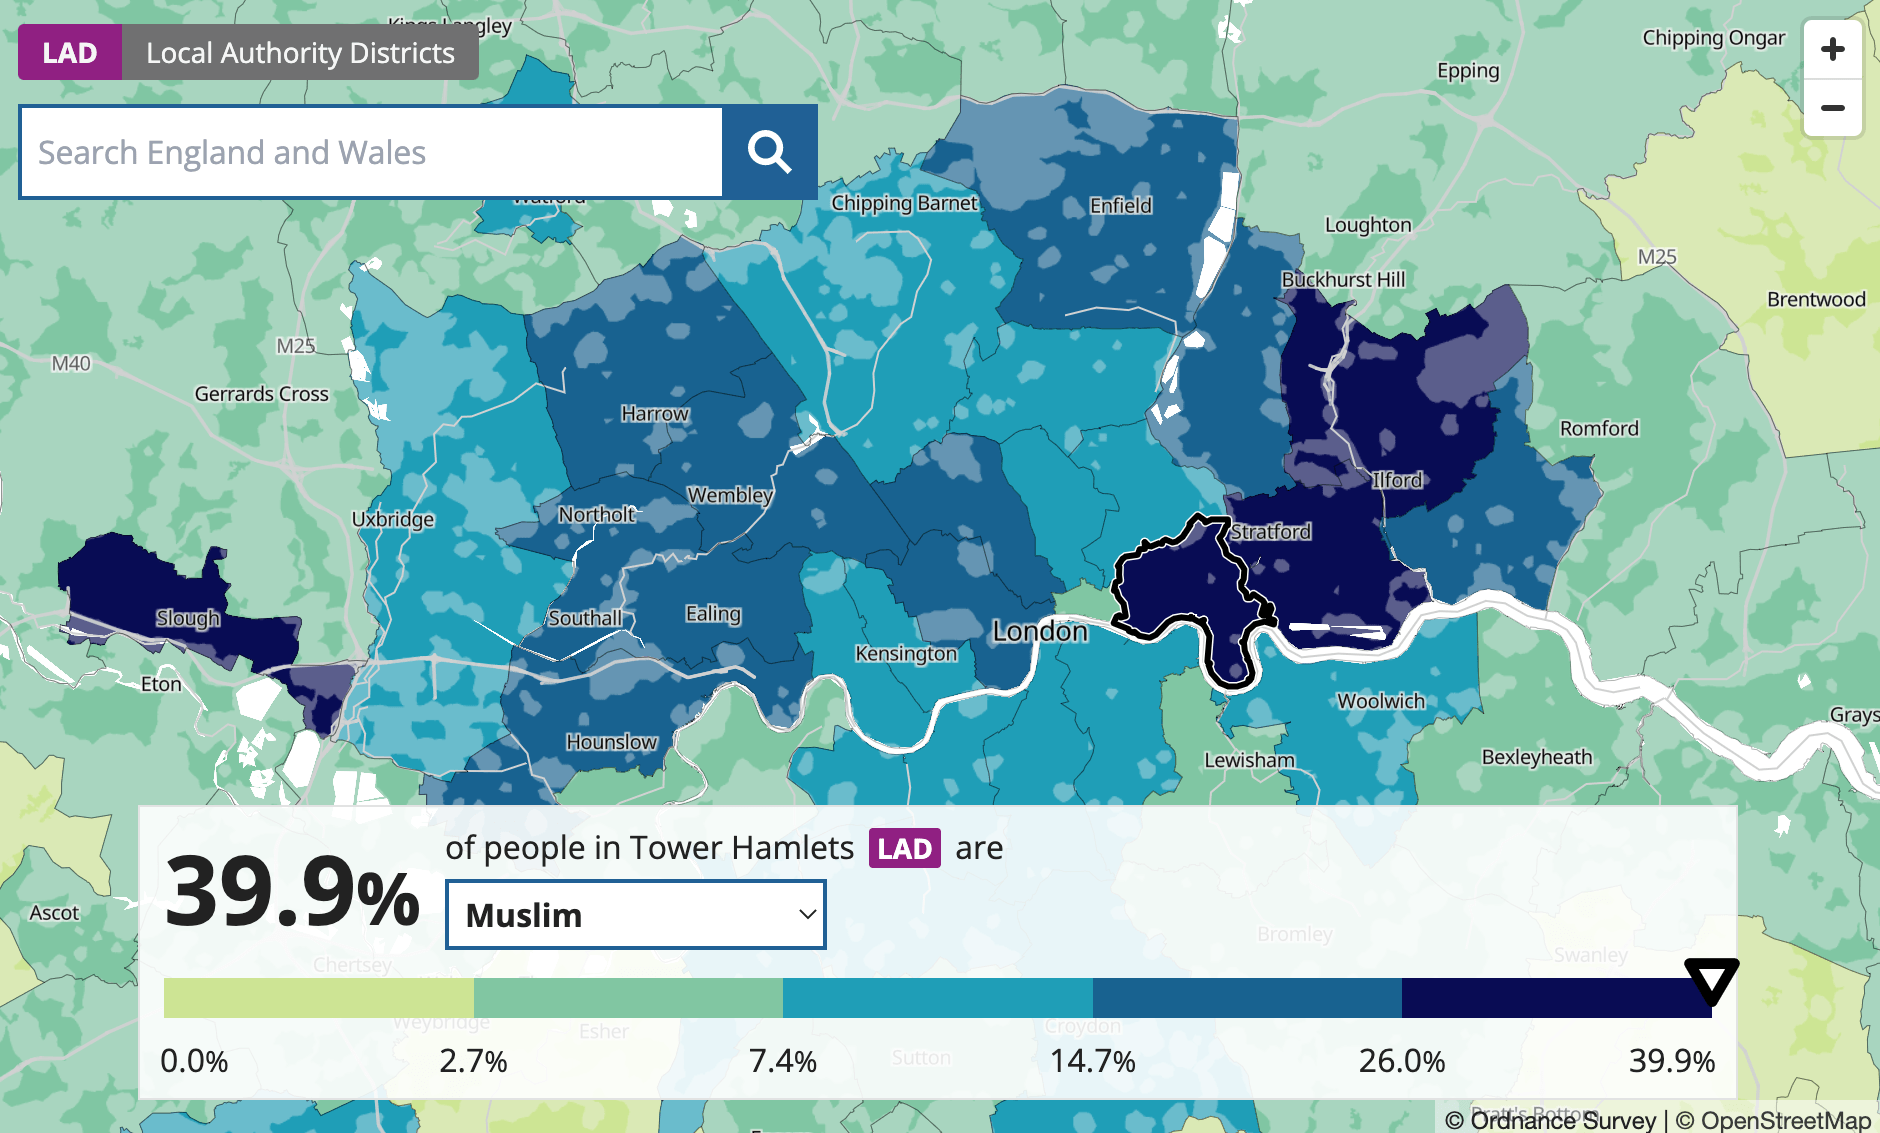
- London remains England’s most religiously diverse region. “Christian” is still the most common response (40.7%, 3.6 million), but 25.3% (2.2 million) identify with other religions, up from 22.6% (1.8 million) in 2021.
- The second most popular response in London was “Muslim” (15%, up from 12.6% in 2011). Tower Hamlets, in East London, had the highest reported share of Muslims in either England or Wales (39.9%, up from 38%).
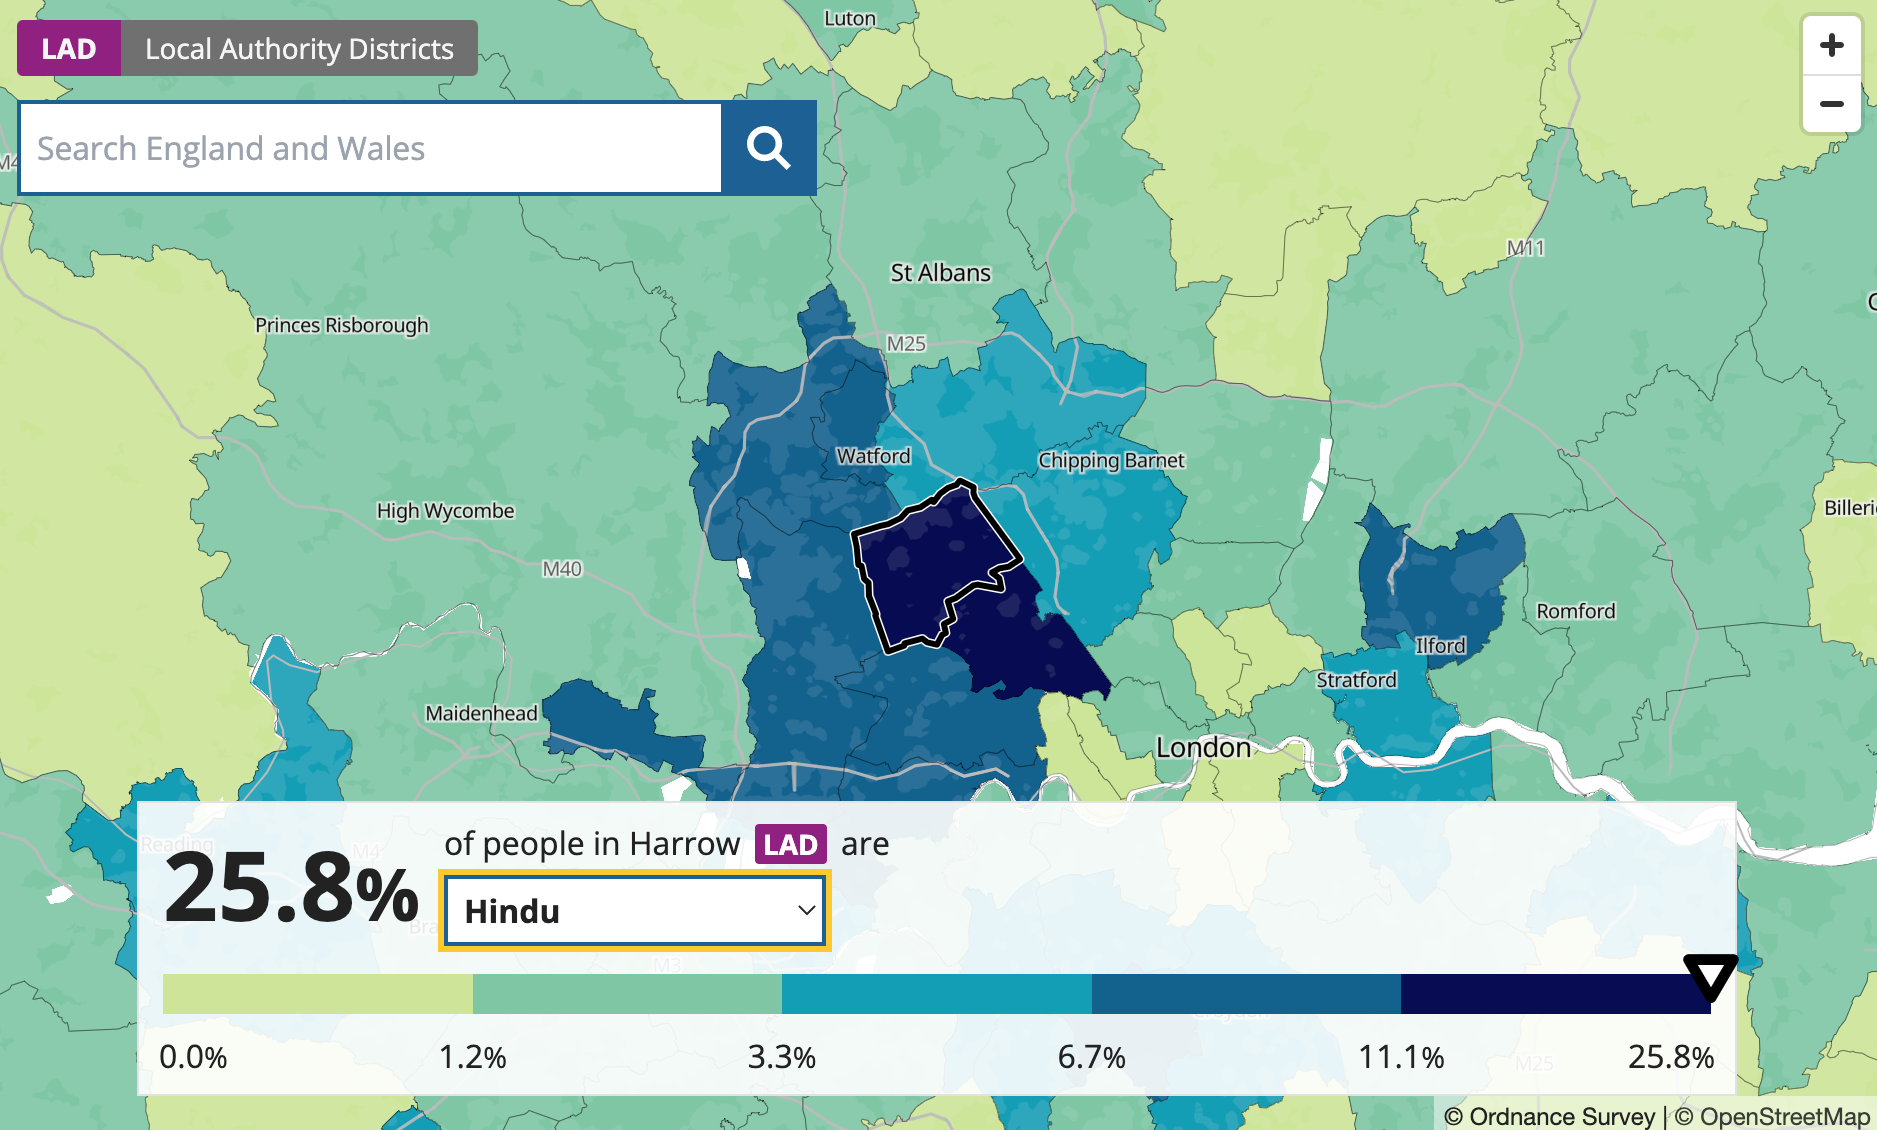
- The third was “Hindu” (5.1%, up from 5%). Harrow, in Northwest London, has the highest share of Hindus in England and Wales (25.8%, up from 25.3%).
Strange Maps #1182
Got a strange map? Let me know at strangemaps@gmail.com.
Follow Strange Maps on Twitter and Facebook.