The Science of Error
How Polling botched the 2016 election
“Distinguishing the signal from the noise requires both scientific knowledge and self-knowledge.” –Nate Silver
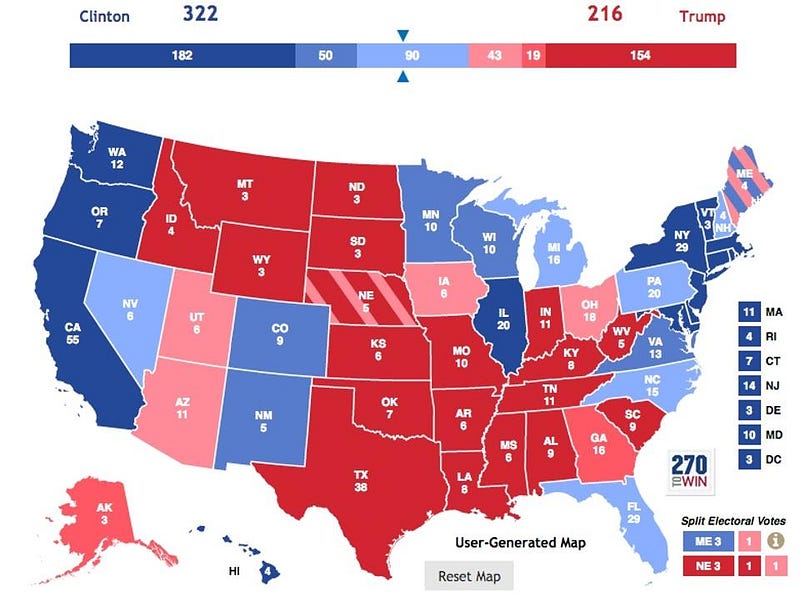
On the eve of the 2016 election, Nate Silver’s 538 site gave Clinton a 71% chance of winning the presidency. Other sites that used the most advanced aggregating and analytical modeling techniques available had her chances even higher: the New York Times had her odds of winning at 84%, the Princeton Election Consortium had her at 95–99% and ABC News had called that Clinton was a lock for 274 electoral votes — enough to win — immediately before voting actually took place. But in a stunning turn-of-events, Trump vastly outperformed what everyone was anticipating from state and national polls, winning nearly all the tossup states plus a number of states predicted to favor Clinton, and he is the new president-elect. Here’s the science of how that happened.
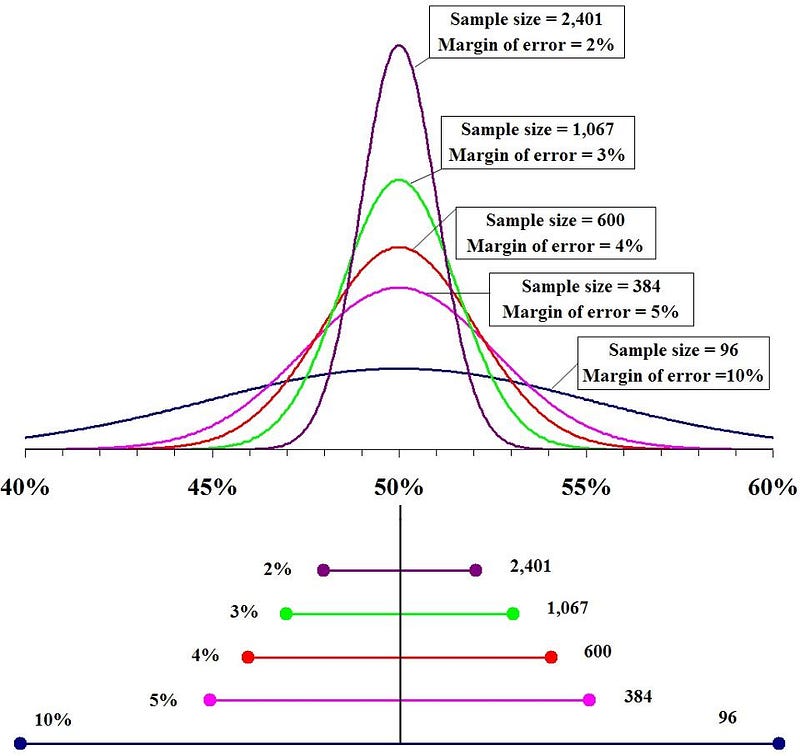
We like to think that, with enough data, we can treat any problem scientifically. This may, in principle, be true of voting predictions, and 2012 seems to serve as a great example: where Nate Silver’s 538 correctly predicted the results of each individual state: all 50. This time, there were many different high-quality and large-data polls out there, at least as many as there were in 2012. And, most importantly, the science behind it is simple. If you want to know how a sample of, say, a million people are going to vote, you don’t need to ask all one million of them to predict the outcome. All you need to do is poll enough people so that you can confidently state the result. So you might decide to poll 100, 500, 2,000 or even 10,000 people, and find that 52% support Clinton in any of those four polls. What they tell you is vastly different, however:
- 100 people: 52% ± 10%, with 95% (2-sigma) confidence.
- 500 people: 52% ± 4.5% with 95% confidence.
- 2,000 people: 52% ± 2.2% with 95% confidence.
- 10,000 people: 52% ± 1.0% with 95% confidence.
These types of errors are known in science circles as statistical errors. Poll more people and your errors go down, and the greater the odds that the sample you polled will accurately reflect what the electorate will actually do.
If you have a truly, perfectly random sample of future voters, this is the only type of error that matters. But if you don’t, there’s another type of error that polling will never catch, and it’s a much more insidious type of error: systematic errors. A systematic error is an uncertainty or inaccuracy that doesn’t improve or go away as you take more data, but a flaw inherent in the way you collect your data.
- Maybe the people that you polled aren’t reflective of the larger voting population. If you ask a sample of people from Staten Island how they’ll vote, that’s different from how people in Manhattan — or Syracuse — are going to vote.
- Maybe the people that you polled aren’t going to turn out to vote in the proportions you expect. If you poll a sample with 40% white people, 20% black people, 30% Hispanic/Latino and 10% Asian-Americans, but your actual voter turnout is 50% white, your poll results will be inherently inaccurate. [This source-of-error applies to any demographic, like age, income or environment (e.g., urban/suburban/rural.)]
- Or maybe the polling method is inherently unreliable. If 95% of the people who say they’ll vote for Clinton actually do, but 4% vote third-party and 1% vote for Trump, while 100% of those who say they’ll vote for Trump actually do it, that translates into a pro-Trump swing of +3%.

None of this is to say that there’s anything wrong with the polls that were conducted, or with the idea of polling in general. If you want to know what people are thinking, it’s still true that the best way to find out is to ask them. But doing that doesn’t guarantee that the responses you get aren’t biased or flawed. This is true even of exit polling, which doesn’t necessarily reflect how the electorate voted. It’s how a reasonable person like Arthur Henning could have written, in 1948,
Dewey and Warren won a sweeping victory in the presidential election yesterday. The early returns showed the Republican ticket leading Truman and Barkley pretty consistently in the western and southern states […] complete returns would disclose that Dewey won the presidency by an overwhelming majority of the electoral vote…
and we all learned how that turned out.
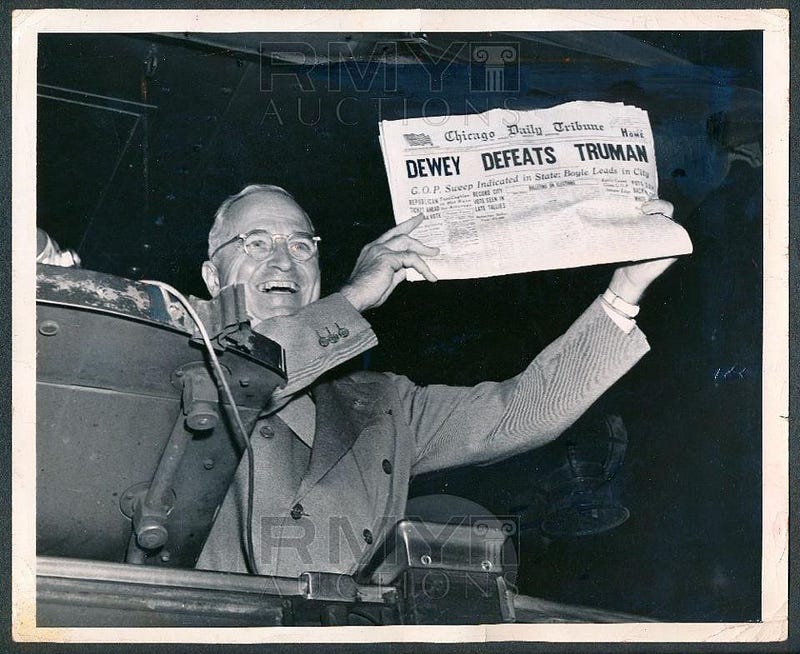
I wouldn’t go quite as far as Alex Berezow of the American Council on Science and Health does, saying election forecasts and odds of winning are complete nonsense, although he makes some good points. But I will say that it is nonsense to pretend that these systematic errors aren’t real. Indeed, this election has demonstrated, quite emphatically, that none of the polling models out there have adequately controlled for them. Unless you understand and quantify your systematics errors — and you can’t do that if you don’t understand how your polling might be biased — election forecasts will suffer from the GIGO problem: garbage in, garbage out.
It’s likely that 2012′s successes were a fluke, where either the systematic errors cancelled one another out or the projection models just happened to be right on the nose. 2016 didn’t shake out that way at all, indicating there’s a long way to go before we have a reliable, robust way to predict election outcomes based on polling. Perhaps it will represent a learning opportunity, and a chance for polls and how they’re interpreted to improve. But if analysts change nothing, or learn the wrong lessons from their inaccuracies, we’re unlikely to see projections ever achieve 2012′s successes again.
This post first appeared at Forbes, and is brought to you ad-free by our Patreon supporters. Comment on our forum, & buy our first book: Beyond The Galaxy!
