Sorry, Skeptics: New IPCC Report Provides Unprecedented Clarity About Earth’s Climate
The scientists, not the fossil fuel industry, were right all along.
Back in 1990, the world’s top climate scientists convened to put together a report on the state of Earth’s climate. Working together collaboratively, they put together the very first IPCC report, where they definitively linked the increased carbon dioxide concentrations in the atmosphere with the increased temperatures that were being seen across the Earth. The CO2 increase from a pre-industrial ~280 ppm to 354 ppm was coupled with a temperature increase of 0.7 °C (1.3 °F), and the alarm was sounded that things were going to get a lot worse unless we took collective steps to mitigate humanity’s impacts on the planet.
Now, in 2021, the 6th IPCC report has just been released, and the situation is far more dire, but our knowledge of what’s occurring is far more extensive. CO2 concentrations now sit at 412 ppm, Earth’s temperature is a full 1.3 °C (2.3 °F) above pre-industrial levels, and still, no meaningful, sustained initiatives to reduce our global carbon emissions have been taken. In fact, they’re presently at an all-time high. The longer we delay meaningful climate action, the more severe the consequences will get not just for all of humanity today, but for generations and even millennia to come. Although our climate future intimately depends on how global emissions unfold in the coming years and decades, the latest IPCC report provides unprecedented clarity on a number of important issues. Here are the top six takeaways we should all accept and understand.
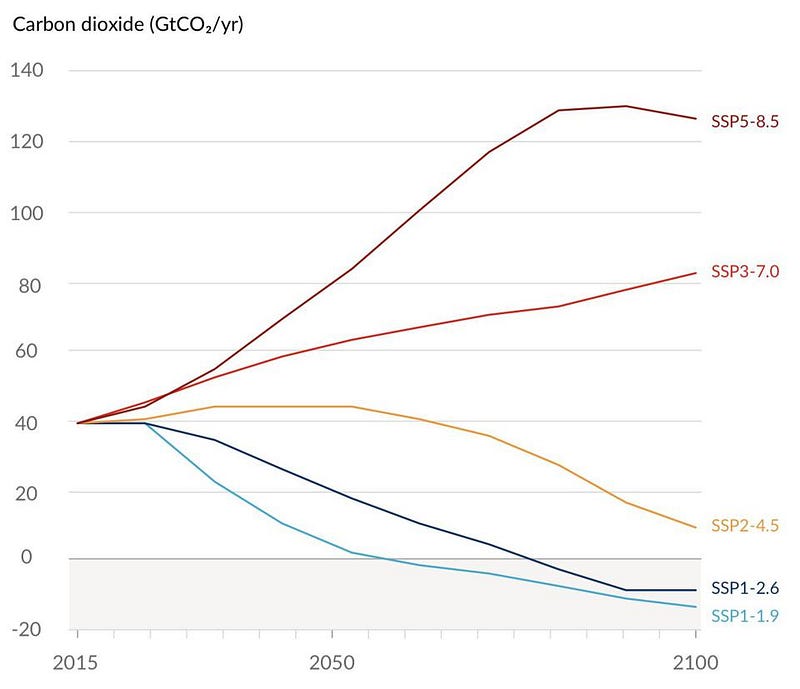
1.) Warming will exceed 1.5 °C in every plausible scenario. This current climate report focuses on 5 separate climate scenarios, as driven by carbon emissions:
- SSP1–1.9, designed to limit temperatures in 2100 to below 1.5 °C warming,
- SSP1–2.6, a slightly more plausible low-end emissions scenario,
- SSP2–4.5, a realistic scenario assuming that current policies are successfully implemented worldwide,
- SSP3–7.0, a high-end emissions pathway where emissions slowly increase and have doubled by century’s end,
- and SSP3–8.5, a more pessimistic high-emissions scenario.
In each of these 5 scenarios, it’s estimated that the Earth will warm by 1.4 °C, 1.8 °C, 2.7 °C, 3.6 °C, and 4.4 °C, respectively. In all cases, we will pass the 1.5 °C mark sometime in the early 2030s: about 10 years from now. In the non-optimistic scenarios for emissions, we will pass 2.0 °C of warming sometime around 2050. None of this, however, means “game over” for the climate. The SSP1–1.9 scenario shows that temperatures will only crest 1.5 °C for a few decades, dropping below 1.5 °C by century’s end. The less time we spend with extreme temperatures on Earth, the more successful we’ll be at mitigating the ill effects of climate change; the more rapidly we decarbonize the energy sector, the better those mitigations will be.
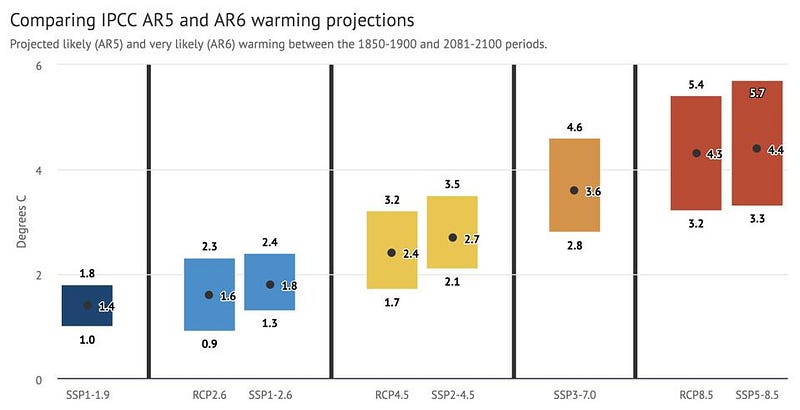
2.) The predicted uncertainties in climate sensitivity has narrowed substantially. If you double atmospheric CO2, the temperature will increase, but by how much? Previously, the “likely” (1-sigma, or 68%) range was between 1.5 and 4.5 °C. As of this new report, that range is now 2.5 to 4.0 °C, with merely half the prior uncertainties. Similarly, the “very likely” range (~90% confidence) is 2.0 °C to 5.0 °C. This reduction in uncertainty is driven largely by combining three different lines of evidence: paleoclimate evidence, physical process models, and the instrument record.
Although the above graph, which shows a comparison between the 5th and 6th IPCC assessment reports, looks very similar in the uncertainties, there’s an enormous point to pay attention to. The prior report, from 2014, shows the “likely” range of temperature outcomes, while the current report, from 2021, shows the “very likely” range of temperature outcomes; there’s only a ~10% chance that something outside of this range could occur. Although there are still substantial uncertainties in the various models, those uncertainties are largely captured and reflected in the published ranges of temperature outcomes.
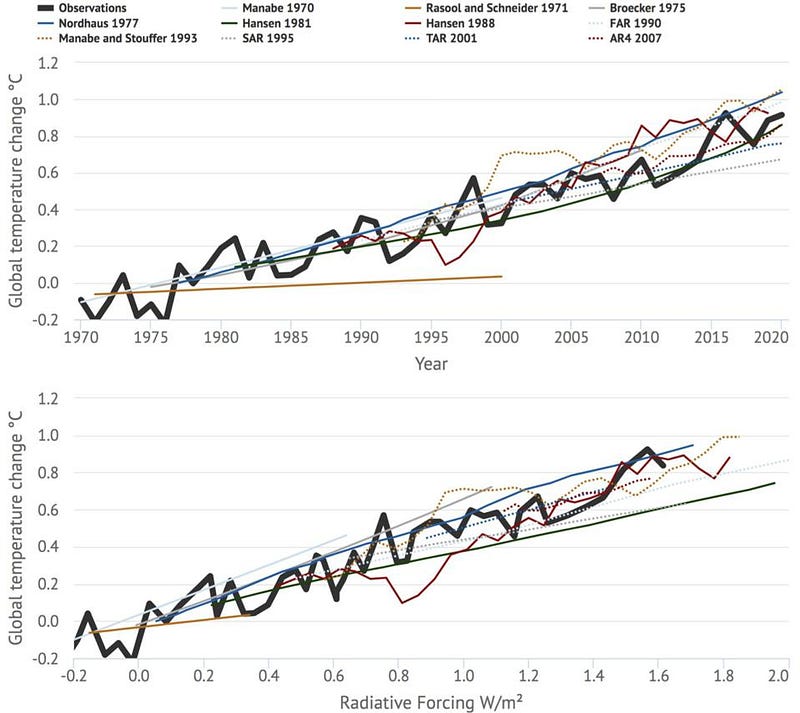
3.) Major, very old climate science predictions — including the hockey stick and warming trends — were all correct. The above graph shows a variety of climate models and their predictions for how the global mean temperature would increase, going as far back as 1970 and showing the prediction beginning the year they were made. The black, thick line shows the actual observed temperature on a year-to-year basis. As you can clearly see with a visual inspection, or as you can robustly find with a more detailed statistical analysis, historical climate models and past IPCC projections have accurately predicted real-world temperatures in subsequent years.
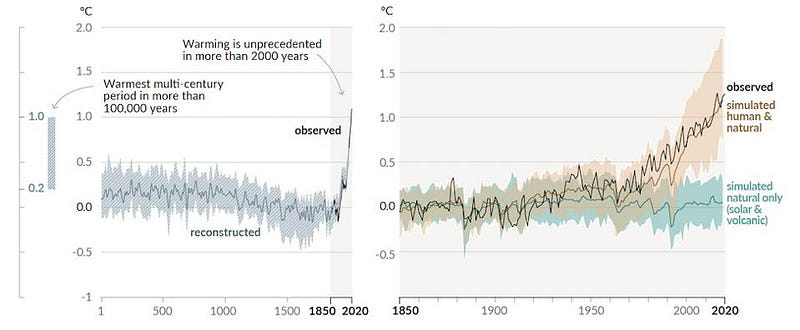
It’s more than just the warming trends, however. The “hockey stick” graph now goes back more than 2000 years, and shows definitively how unprecedented the modern warming trend is; the first two centuries of the 3rd millennium will be warmer than any multi-century period over the past 100,000 years. Skeptics often question how much of the warming is due to natural factors versus how much is due to human activity, and the latest report has answered that: approximately ~95–100% is human-caused; approximately ~0–5% is natural (due to solar and volcanic effects).
Humans are the cause of this unprecedented warming, and it is up to us to be the solution, too.
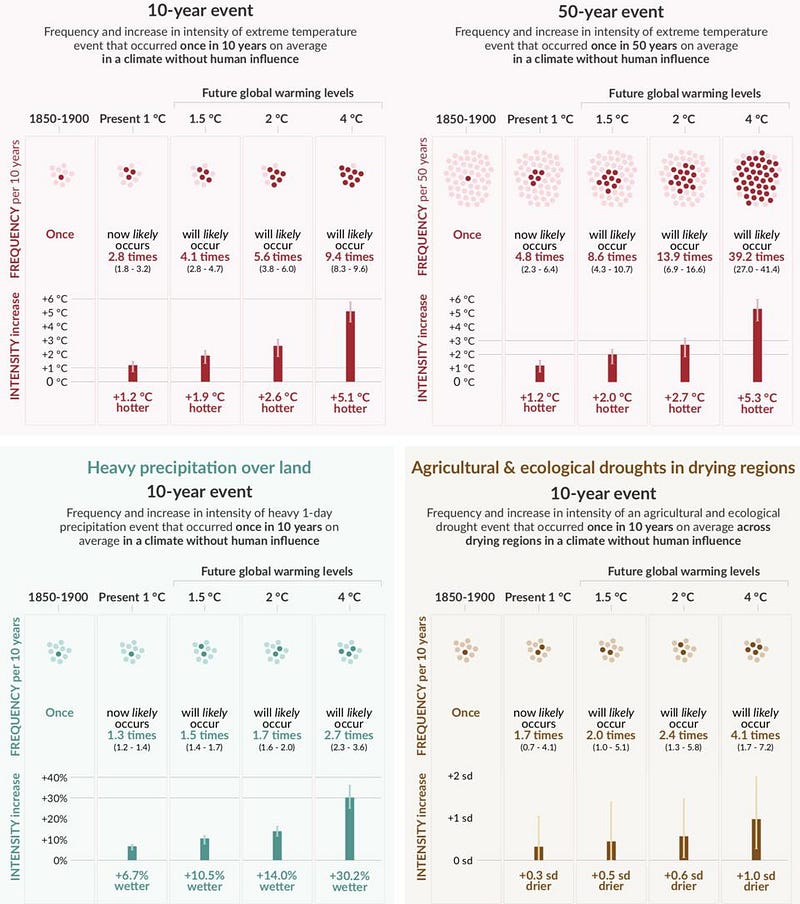
4.) Extreme events — heat waves, droughts, floods, and even hurricanes — will all be more frequent and/or severe. This one is an enormous advance that hasn’t gotten enough attention in recent years. Just last decade, most of the discussion around extreme weather events occurred in generalities. We would talk about the distribution of events in a statistical sense: the mean baseline moved and perhaps the spread increased as well, but there wasn’t a good way to examine a particular event and to answer a question like, “how much worse was this particular event made by human activity?”
The same combination of observations that made the earlier reduction in uncertainties possible, including paleoclimate, instrument readings, and process modeling, also enables us to quantify how extreme events are linked to climate change. The picture, in a nutshell, is not pretty. The below set of graphs show the incidence of heatwaves, floods, and droughts will occur. The takeaway is clear: events that used to be once-a-decade or even once-per-50-years are now occurring almost annually. For those of you wondering about hurricanes, the prevalence of category 3, 4, and 5 hurricanes has increased dramatically due to climate change as well.
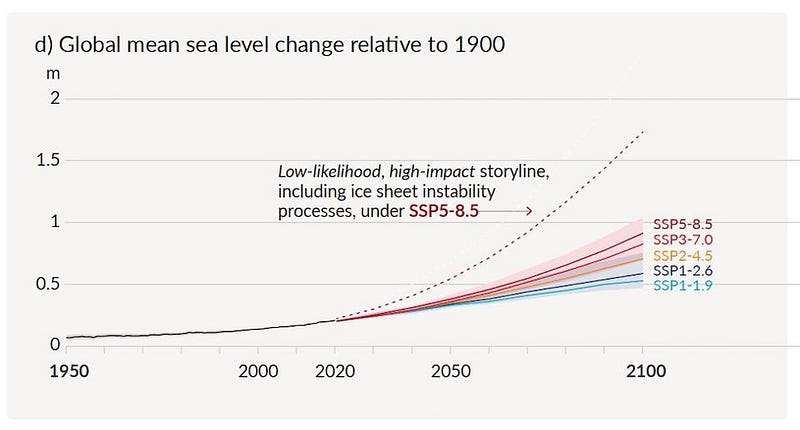
5.) Sea level rise will be severe and long-lasting no matter what path we take. The biggest risk, of course, is that an abrupt and colossal change occurs: what we’ve typically called a “tipping point” in the past. Two of these are intimately related to the seas: ice sheet collapse and abrupt changes in ocean circulation. Most projections result in 0.5–1.0 meters of sea level rise through 2100, with an acceleration occurring in the moderate and high-end emissions scenarios.
However, a destabilized Antarctic ice sheet (below, dotted line) shows what sort of catastrophic sea level rise would ensue. According to the IPCC, “global mean sea level rise above the likely range — approaching 2 m by 2100 and 5 m by 2150 under a very high… emissions scenario — cannot be ruled out due to deep uncertainty in ice sheet processes.” Just as many extreme weather events will occur more frequently, so will coastal flooding events, particularly along certain regions such as the United States’s Gulf and Atlantic coasts. A combination of sea level rise, tidal cycles, and shifting ocean currents could transform what were once-in-a-century flooding events into annual events by 2100.
The report also warns that the combination of deep ocean warming and ice sheet melt will likely, with high confidence, result in elevated sea levels for millennia. If warming is limited to 1.5 °C, 2 °C, or 5 °C over that term, sea levels will rise by 2–3 m, 2–6 m, or 19–22 m for each of those three scenarios. (That is not a typo!)
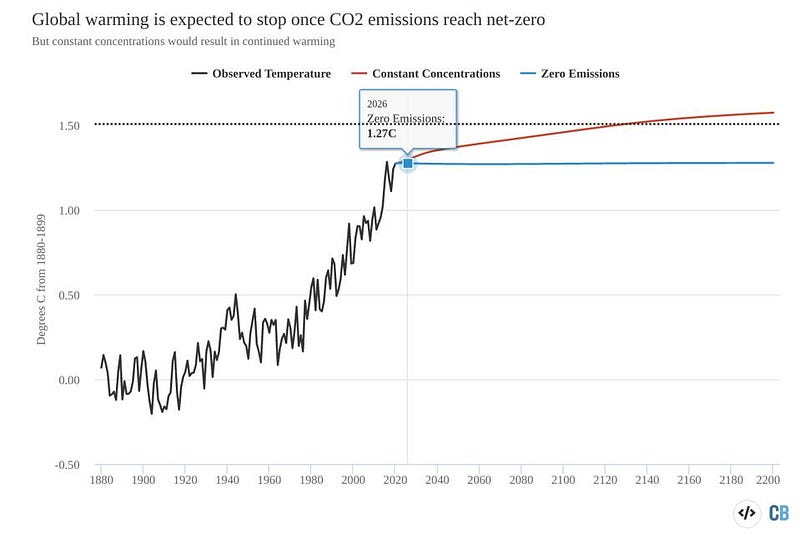
6.) Achieving zero net CO2 emissions is mandatory, and the timescale is key. With reduced uncertainties, tighter and more robust predictions, and a clear vision of our future, the latest IPCC report shouldn’t alarm us, but rather should inform us and spur us to what’s desperately needed: climate action. The “lukewarmer” argument, where some skeptics hoped that climate change would be on the milder end of what’s expected, can now be ruled out. However, so long as no low-risk, high-impact events occur, warming of ~6 C and above also appears unlikely so long as we don’t exponentially increase our emissions.
There’s reason for optimism, however. Once we reach the point — and we all assume that we someday will — where we achieve net-zero carbon emissions, global warming will pretty much cease at that time. Even though temperatures lag carbon dioxide concentrations, once we reach that net-zero emissions goal, we can now predict that the atmospheric CO2 concentrations will decrease, leading to roughly level temperatures. (Temperatures will drop if we move to negative carbon emissions.) The Zero Emissions Commitment Model Intercomparison Project (ZECMIP) is discussed thoroughly in the new IPCC report, and agrees with an important 2010 paper. The conclusion is that as soon as we hit net-zero emissions, the temperature will roughly be frozen-in at that value unless/until negative emissions work to reverse the warming trend.
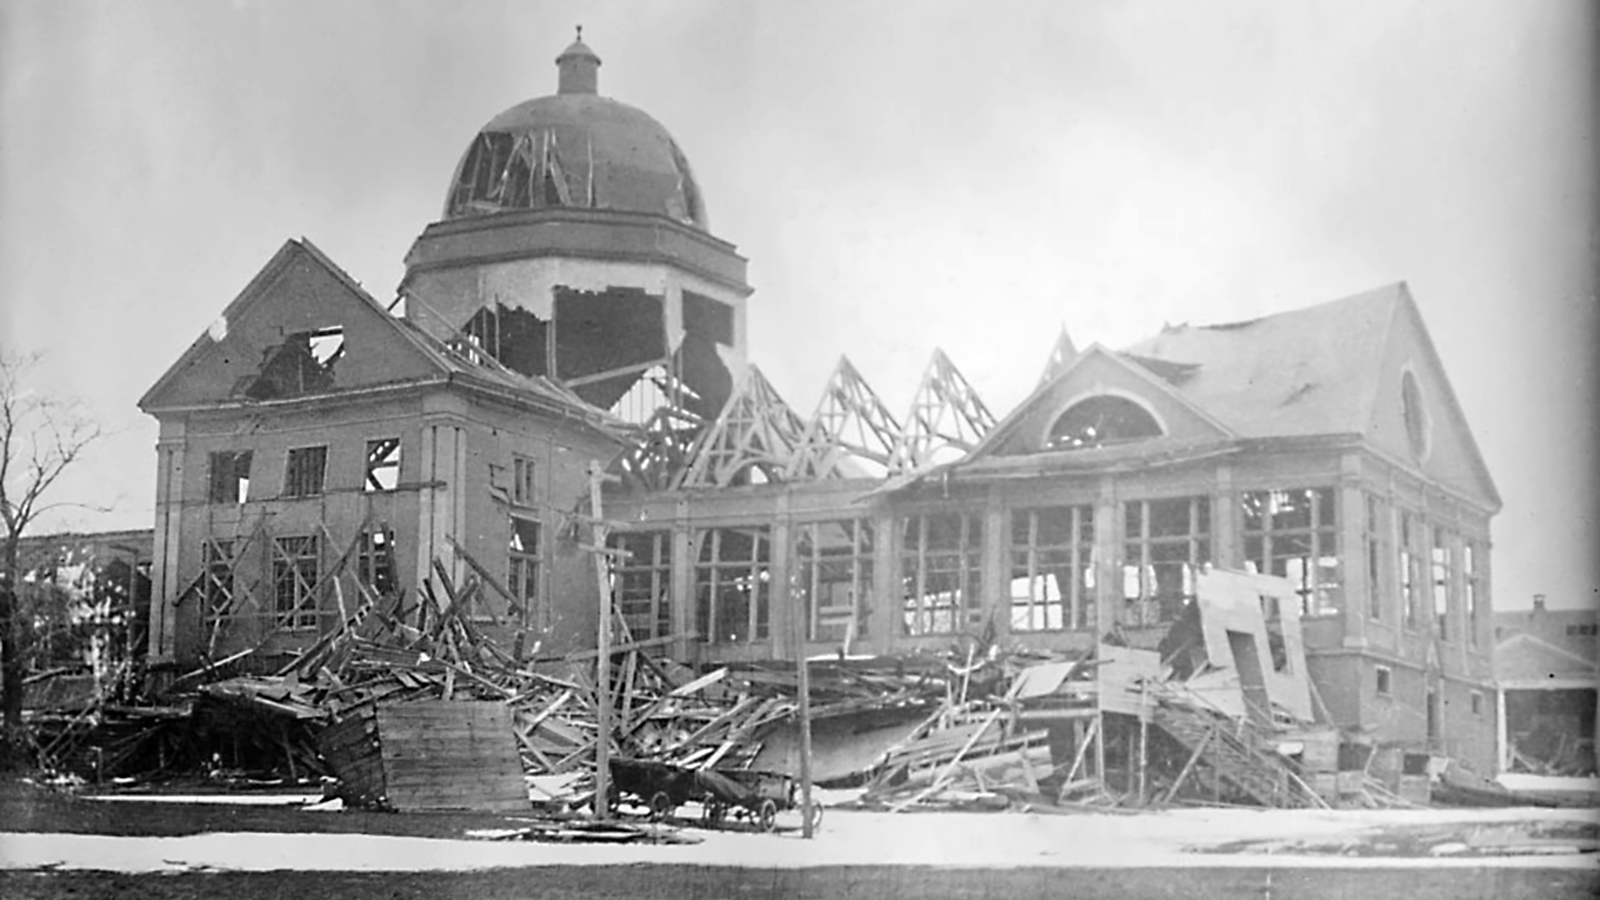
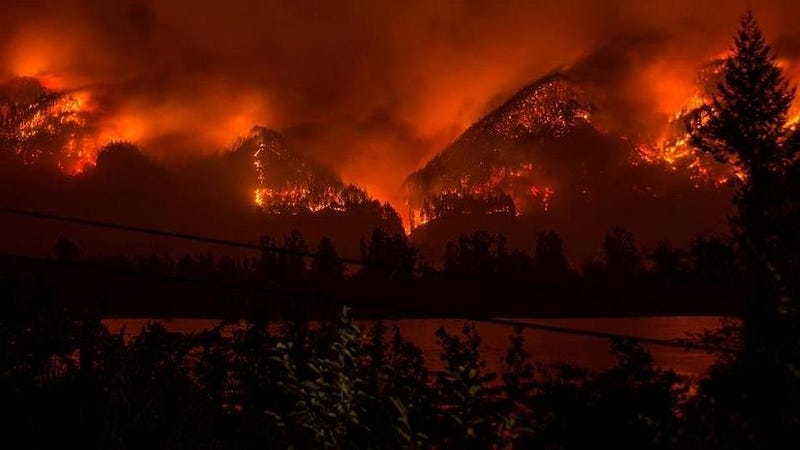
Even though these six takeaways summarize the key points very effectively for scientists, it’s very difficult for most people to understand these rather abstract conclusions. To help bring home exactly what this means, I’d like to take you back to an event that happened in the Columbia River Gorge — the canyon along the Columbia River separating Oregon from Washington State — back in 2017. The Pacific Northwest is typically hot and dry during the months of August and September, posing a severe wildfire risk and leading to numerous burn bans across the western areas of North America.
On the afternoon of September 2nd, hiker Kevin Marnell, hiking along Eagle Creek in the National Scenic Area there, heard a series of loud bangs, reminiscent of gunfire. Just minutes later, he saw thick smoke rising nearby from down the mountain slope, closer towards the river. Despite this being a protected area, despite the burn bans, and despite the enormous amount of educational efforts that had gone into wildfire prevention (more than 80% of all wildfires are started by humans, rather than natural causes), this quickly grew into the now-infamous Eagle Creek fire, which:
- stranded 153 hikers,
- caused the evacuation of thousands of people across 6 towns,
- burned approximately 50,000 acres along the only navigable waterway from the Cascade Mountains to the Pacific Ocean,
- and caused tens of millions of dollars in property damage.
What most people don’t remember from that 2017 fire is the story of how it began, but it’s burned into my memory because of my experience being a teenage boy. When I was 13, my friends and I very much enjoyed getting our hands on small explosives: firecrackers, M-80s, Roman candles, etc. When it was my turn to play, I would light the fuse and run away, but a kid I knew, Todd, liked to play a game that terrified me: light the fuse, hold it as long as possible, then throw it as high as he could just before ignition, attempting to cause a mid-air explosion. (Playing such games with explosives is not without risk, as my now-blind friend Tyler can attest.)
Similarly, two (at least) teenage boys were playing a game with these small explosives:
- light them,
- throw them down the mountain towards the river,
- and attempt to get them to land in the river, but as close to dry land as possible.
To no one’s surprise, the very first errant throw — the first one to land on dry land instead of in the river — started what would become this catastrophic fire, whose ramifications are still being felt today. The problem isn’t that “something went wrong” with the game; the problem is that anyone attempted to even play this game in the first place.
In many ways, as a society, it’s illustrative of how we’re incorrectly responding to societal problems that have a scientific solution. You cannot eradicate a virus when people keep engaging in activities — like not wearing a mask and refusing vaccinations — that incubate and spread it. You cannot reduce the damage from wildfires when we don’t properly fund forest management and even a small number of humans keep starting them. And you cannot mitigate the worst consequences of a warming planet if we do not collectively reduce the carbon emissions that actively cause the planet to warm.

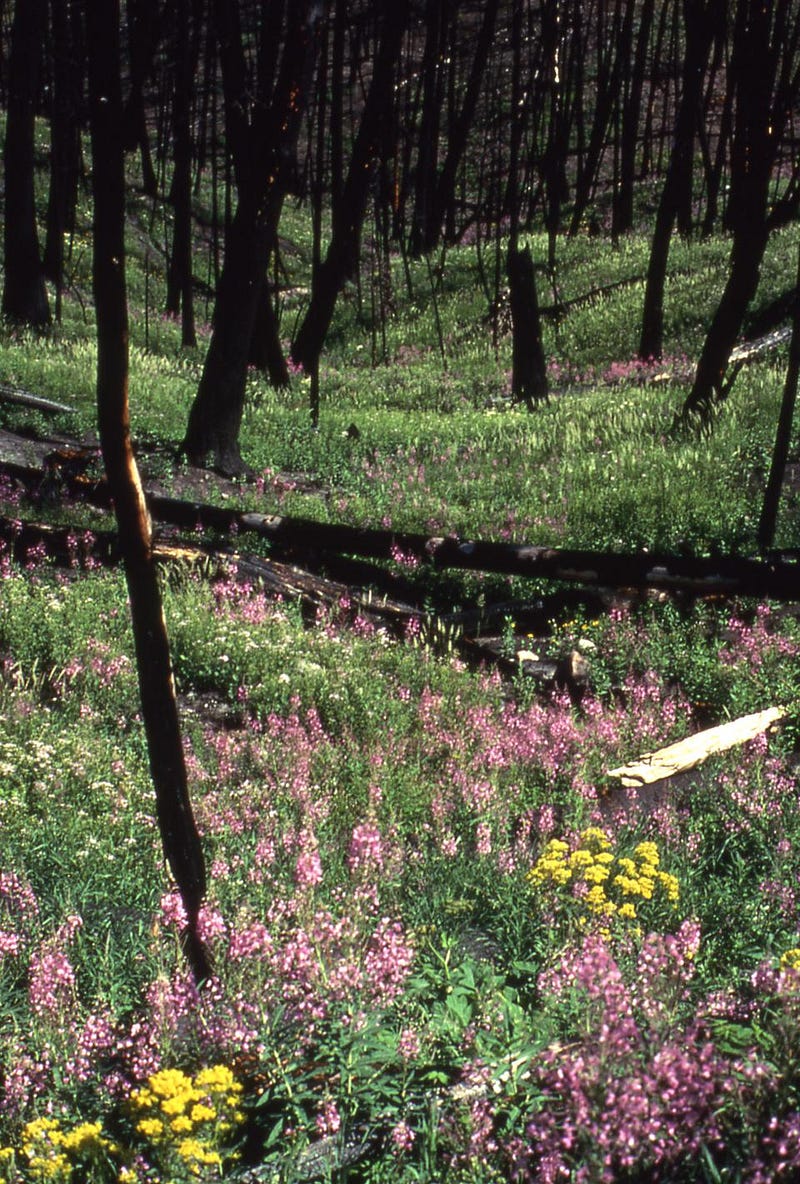
When collective action is required, individual freedom to engage in the opposite action is the enemy of us all. It’s long past time for policymakers to catch up to the science, but there is good news. Just as the burned area of the Columbia Gorge has already started to regrow, we know precisely how to heal the Earth from the damage we’re continuing to inflict. Mandating and enforcing a rapid global reduction in carbon emissions, re-wilding large areas of the Earth, and doing it sooner rather than later, could potentially leave the planet in better shape by 2100 than it is, today, in 2021. But this won’t happen without a sustained change in global policy that does not blow with the fickle political winds: what’s needed now is not more reports, but sustained and coordinated action. The future of the Earth, and our species, is literally in our hands. What we do about it will impact all of us for years, generations, and even millennia to come.
Starts With A Bang is written by Ethan Siegel, Ph.D., author of Beyond The Galaxy, and Treknology: The Science of Star Trek from Tricorders to Warp Drive.