New Study Challenges The Universe’s Expansion, But Remains Unconvincing

Small sample size? No underlying theory? Conflicts with all other results? It checks all the boxes.
There’s nothing that’s special, on a cosmic scale, about our place in the Universe. Not only are the laws of physics the same everywhere we look, but the Universe itself has the same large-scale properties everywhere. In all directions and at all locations, the number of galaxies, the amount of clustering, the cosmic expansion rate, and a whole host of other measurable properties are virtually identical. On the largest scales, the Universe really does appear to be the same everywhere.
But there are many different, independent ways to test the idea that the Universe is the same in all directions: what astrophysicists call “isotropy.” In a new study in the April 2020 issue of Astronomy & Astrophysics, a new technique, analysis, and data set are all applied to this puzzle, and the authors claim that the Universe’s expansion rate is different dependent on which direction we look. It’s an interesting result if true, but there are lots of reasons to be skeptical. Here’s why.

There’s one overarching theory that not only governs the Universe, but provides the framework for understanding what ought to exist on the largest scales: the inflationary hot Big Bang. This states, in a nutshell, that:
- there was a period of cosmic inflation that occurred before the Big Bang,
- providing the seed fluctuations from which all of our cosmic structure would grow,
- and then inflation ended, leading to the hot Big Bang and a matter-and-radiation-rich Universe,
- that was uniform, everywhere, to about 1-part-in-30,000,
- which then expanded, cooled, and gravitated,
- leading to the vast and expansive cosmic web we observe today.
Overall, this means that on the largest scales, the Universe should be isotropic (the same in all directions) and homogeneous (the same in all locations), but on smaller scales, local variations should start to dominate.
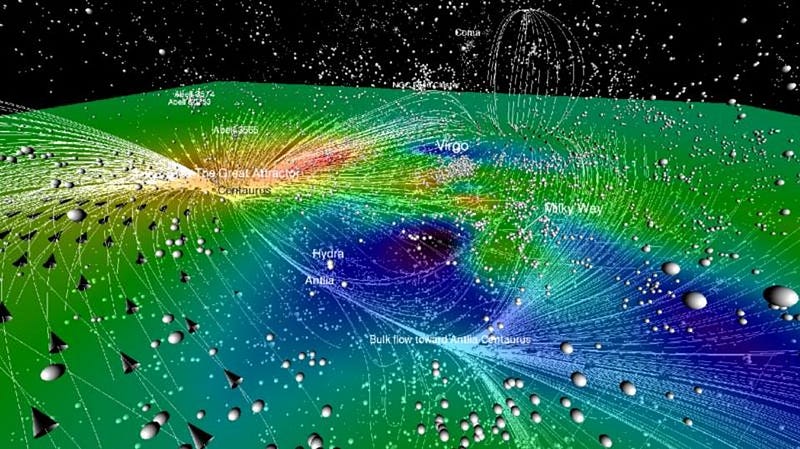
These local variations are most definitely real. When we look at how galaxies move throughout the Universe, we find that they do obey the standard Hubble expansion on average, particularly at very large distances: where how fast each galaxy appears to recede is directly proportional to how distant the galaxy is. But each galaxy also has a peculiar velocity, superimposed atop the overall expansion, that can cause additional motions up to a few thousand kilometers per second: 1–2% the speed of light.
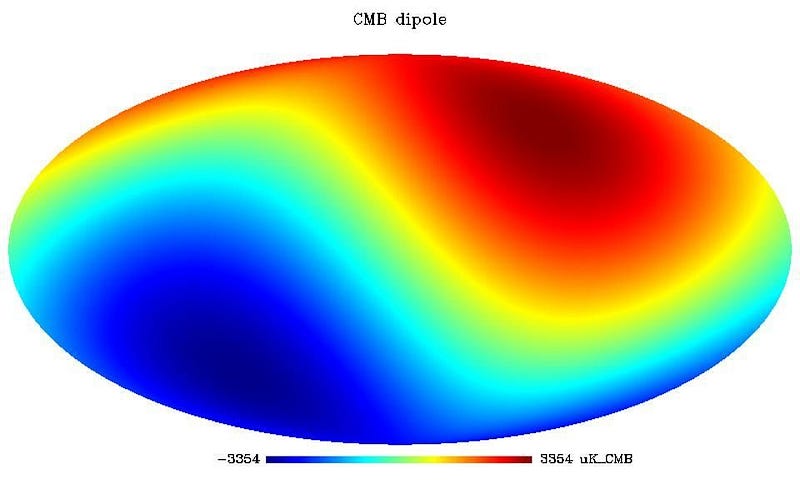
We see this everywhere we look, from the motions of individual galaxies on small scales to the flowing motions of galaxy clusters on intermediate scales to the motion of our own local group. But most importantly (and to the highest precision), we see our own motion with respect to the Cosmic Microwave Background, which itself should be perfectly isotropic, up to the effect of our own motion through space.
It would be a tremendous surprise if the Universe weren’t isotropic on large scales, particularly if its anisotropy were above a certain amplitude. But we can’t simply take one or two sets of observations (like the Cosmic Microwave Background and the large-scale structure of the cosmic web) and declare that the Universe is isotropic. We should be measuring the Universe in every way possible in an effort to determine what levels of anisotropies exist on all scales.
But that requires that we do it accurately, comprehensively, and unambiguously. A poor calibration, an untested or unverified assumption, or any number of systematic errors could lead you to conclude you’ve found an anisotropy where none existed previously. The new study in question, promoted by NASA’s Chandra X-ray Observatory, is suggestive of a large-scale anisotropy, but doesn’t quite reach the level of a compelling find.
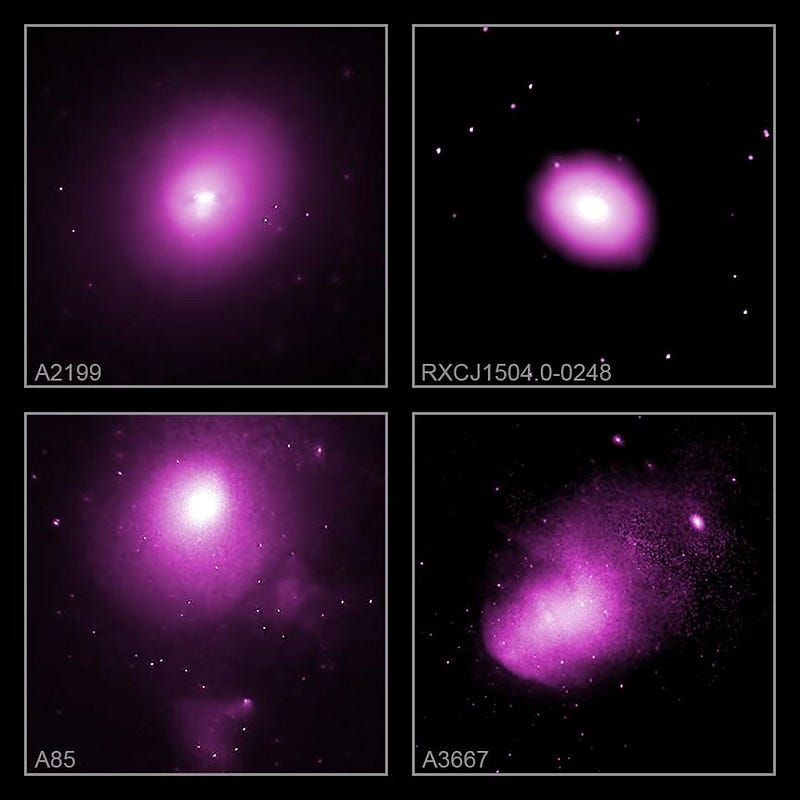
The way the new study worked is that they took a large number of X-ray clusters — large clusters of galaxies that emit massive amounts of X-rays — and applied what’s known as an empirical correlation. An empirical correlation is when we see that two distinct things we can either measure or calculate about an object appear to be related, but we don’t physically understand why they’re related.
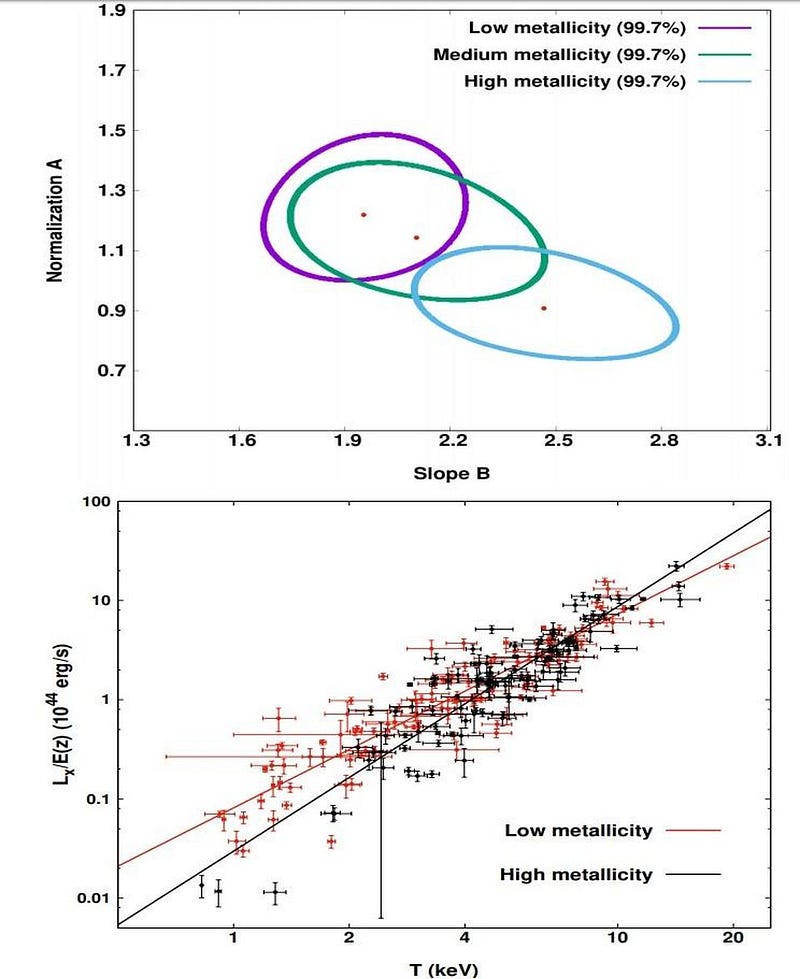
In this case, they used a correlation between the intrinsic brightness of the X-ray light (i.e., luminosity) and the observed temperature of the X-rays. This is a relatively new correlation, and it appears to be relatively good at all temperatures, despite the large scatter. However, as you can see from the graph below (taken from the paper), there’s a troubling aspect immediately. The correlation itself appears different depending on which observatory is actually measuring the X-rays.

Whenever you have an empirical correlation, it’s also important to make sure that it isn’t sensitive to other parameters as well: parameters that might cause this correlation to vary. Sure, there’s a relationship between luminosity and temperature, but do you get the same correlation if you look at X-ray clusters with different masses, different velocity dispersions, different amounts of heavy elements, etc.?
These are important questions to ask, because the answer should be “no” to each of these. But, as the authors quite clearly demonstrate, you get enormous differences in the parameters underpinning this correlation if you look at X-ray clusters with different amounts of heavy elements: what astronomers call metallicity. In an ideal world, an empirical correlation would be identical irrespective of varying these parameters. But clearly, that’s not the case at all.
These aren’t necessarily dealbreakers, but they are very valid and compelling reasons to be cautious. If we’re going to make the assumption that this relationship is universally valid, and that we can use it as a probe of the underlying cosmology, we have to recognize that we’re going to be looking for very subtle effects. We’re not just trying to average over the entire sky and all the X-ray clusters we find, after all, but we’re looking for tiny differences between one direction versus another.
Any difference that exists between these populations we’re finding in one region of the sky and another region of the sky can bias our results, particularly if we’re assuming a single, universal relationship between our two quantities (luminosity and temperature). The authors of this paper note that biases need to be studied (and show that at least some are present), but then use a single universal relationship when performing their analysis. If these X-ray clusters don’t all obey that inferred relationship in the way the authors propose it, this line of thinking is invalid.
Another problem of using galaxy clusters is that they’re very large objects, and there aren’t that many of them in any given volume of the Universe. Although this study does go out a few billion light-years, larger than most similar studies looking to probe cosmic anisotropy, it only consists of a few hundred galaxy clusters. This isn’t anyone’s fault; this is at the limit of what our current instrumentation and technology can measure.
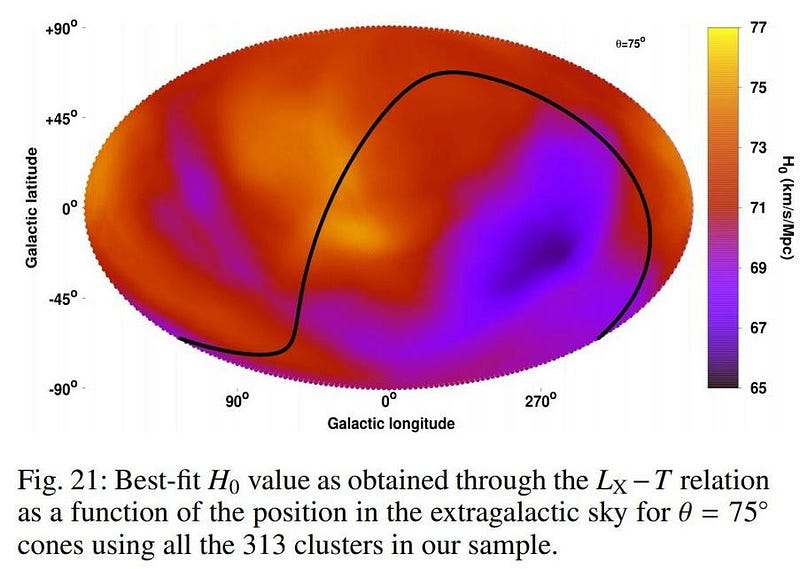
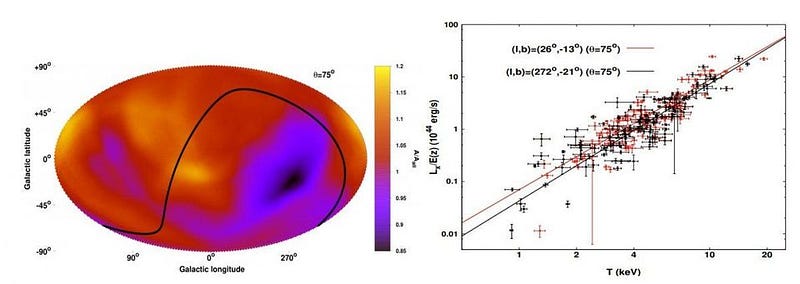
What they find is that the overall expansion rate appears to be higher in one particular location of the sky, shown in light colors (below), than in an opposing region of the sky, shown in the same image in dark colors. The authors also note that this is a relatively subtle effect, failing to rise to the necessary 5-sigma “gold standard” for discovery, and that if you try and exclude any of the data due to concerns about how reliable it is, the result gets less and less significant.
Finally, the last result they present is by using all of the X-ray clusters across all data sets, even those not imaged by Chandra or XMM-Newton, which necessarily incorporates much less reliable data. They show that the effect persists and even intensifies, which is what you might expect if this were a real effect. But this is also what you’d expect if there were an error, a bias, or an incorrectly applied or calibrated sample.
This should be a big worry. Recently, there have been all sorts of grandiose claims that cosmology is in crisis, but most of them fall apart on even a cursory scrutiny for exactly this reason. Claims that dark energy doesn’t exist relied on incorrect calibrations of our motion through the Universe; claims that the fine-structure constant varied with either time or space were refuted by improved analysis; claims that quasar redshifts are anisotropic fell apart when the Sloan Digital Sky Survey’s data came in.

The biggest worry should be that something is biasing this data before it ever arrives at our telescopes’ eyes. In particular, heavy elements along the line-of-sight to any galaxy cluster will dim the X-ray signal we observe. The authors account for this by measuring the hydrogen gas density along the line-of-sight, and then inferring the amount of heavy elements that should be there to model the effects. It’s a reasonable approach, although this inference is not an easy one to make with a great deal of accuracy.
But they don’t appear to model another effect that should impact the amount of X-rays we observe: foreground dust. Dust absorbs X-rays, is found where neutral hydrogen gas isn’t, and it is most definitely not uniformly distributed on the sky. If dust is modeled incorrectly — or worse, not at all — they could be reaching incorrect conclusions about the Universe’s expansion because of its effects on the incoming light.
It is eminently possible — and tremendously interesting and even revolutionary if true — that our assumptions about the magnitude and scale of anisotropies in the Universe are flawed. If so, it will be data about the large-scale structure of the Universe, going well beyond our local corner of space, that demonstrates it. X-ray clusters, such as the ones discussed and analyzed here, might be the first robust test that discovers it, if so. But this new study is only a clue in that direction, one with many reasonable objections. The sample size is small. The correlation used is new and its universality is dubious. Foreground effects are not sufficiently modeled. And the data itself could be a lot better.

Although the authors look to upcoming eROSITA data as the next step along this path, they should be looking farther afield. A truly next-generation X-ray observatory, like ESA’s Athena or NASA’s Lynx, is the tool really needed to gather the decisive data, along with complementary large-field, deep optical surveys that we’re expecting from ESA’s Euclid, NASA’s WFIRST, and the Vera Rubin Observatory’s LSST. The Universe’s expansion may not be the same in all directions, but it’s going to take a lot more than this one study to prove it.
Ethan Siegel is the author of Beyond the Galaxy and Treknology. You can pre-order his third book, currently in development: the Encyclopaedia Cosmologica.