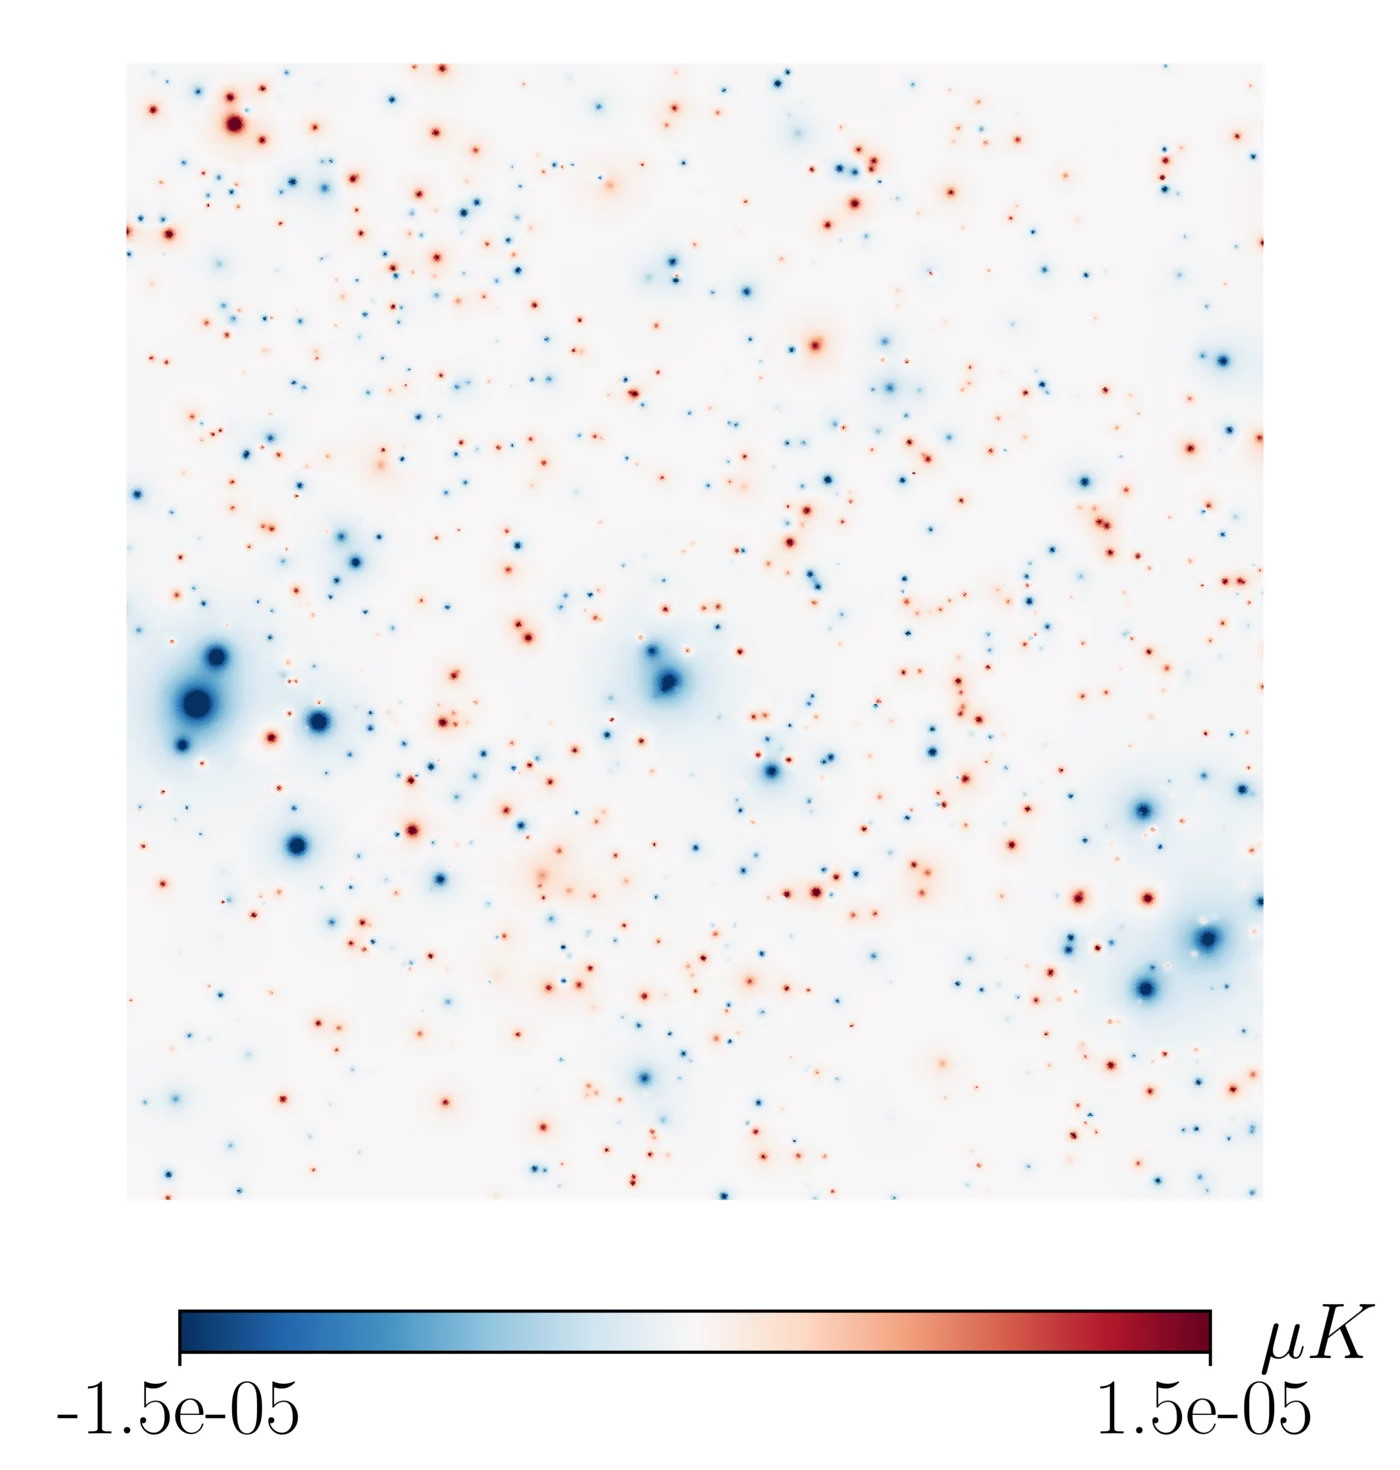
At lower left, the actual signal of the temperature fluctuations is shown. In the other three panels, possible modifications to the microwave sky are shown due to rotation or other forms of anisotropy. By constraining the magnitude of these signals, we can demonstrate just how isotropic (the same in all directions) and non-rotating the Universe actually is. However, indicators other than the CMB do not give consistent results with what we observe here.
(Credit: D. Saadeh et al., Phys. Rev. Lett., 2016)
The most puzzling, unexplained anomaly in all of cosmology is the Hubble tension: the difference in the measured expansion rate depending on which method is used.
However, a second, less-publicized anomaly is also extremely puzzling: a difference in our observed motion through the Universe and how different things appear in various directions.
We have many different methods of estimating how the Universe differs in different directions, and they’re not all consistent with one another. That’s a real, unsolved, but important problem!
Sorry, astronomers: the expanding Universe doesn’t add up.
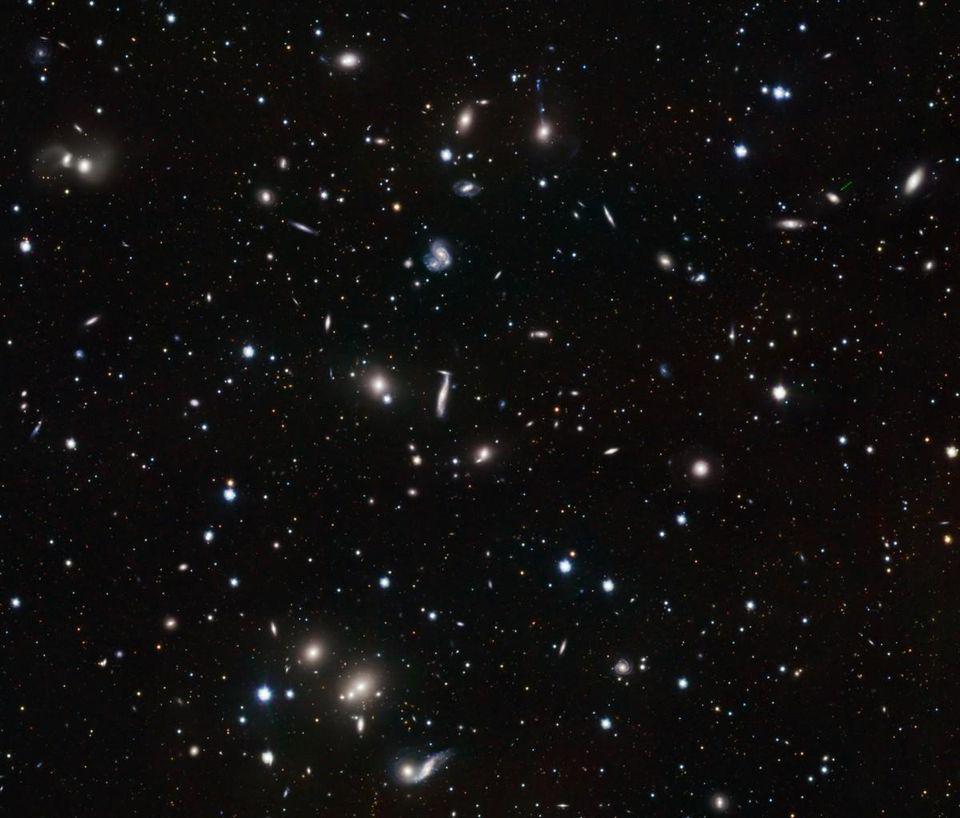
The galaxies shown in this picture all lie beyond the Local Group, and as such are all gravitationally unbound from us. As a result, as the Universe expands, the light from them gets shifted toward longer, redder wavelengths, and these objects wind up farther away, in light-years, than the number of years it actually takes the light to journey from them to our eyes. As the expansion relentlessly continues, they’ll wind up progressively farther and farther away.
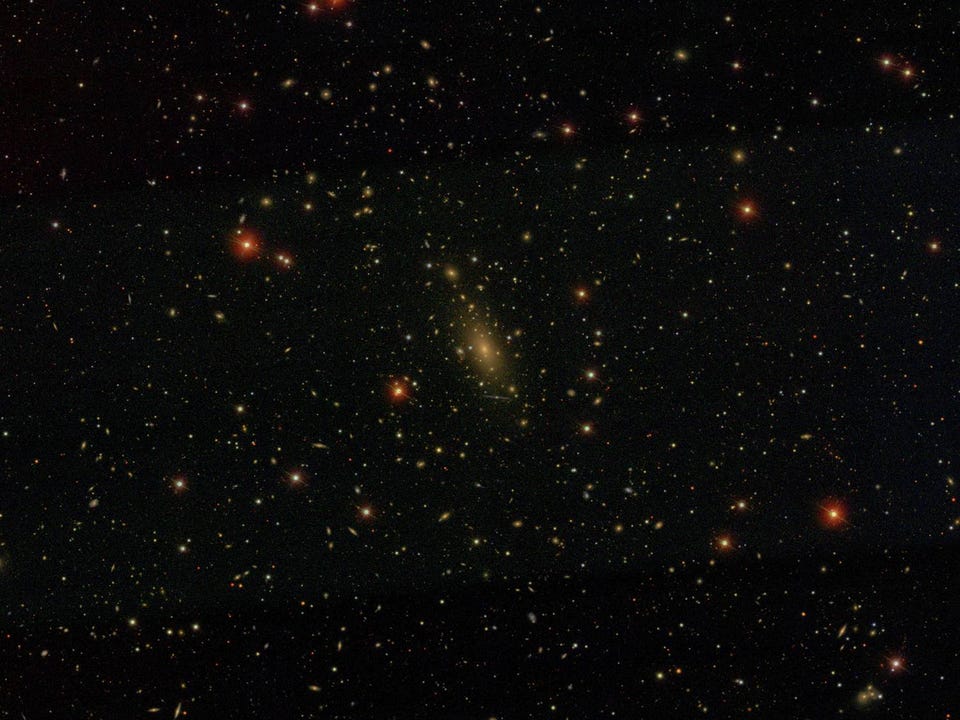
Credit: ESO/INAF-VST/OmegaCAM. Acknowledgement: OmegaCen/Astro-WISE/Kapteyn Institute
The largest anomaly is the Hubble tension.
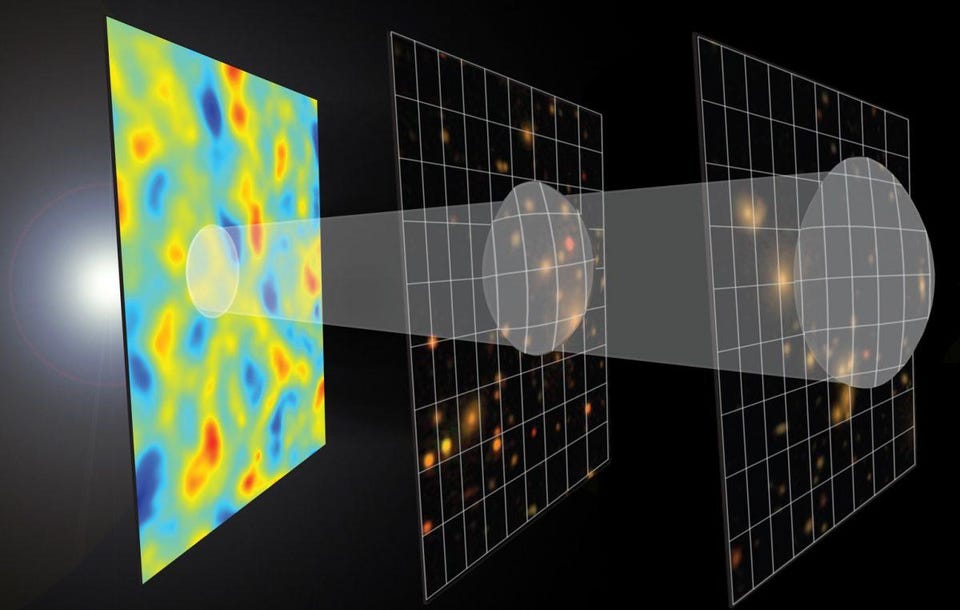
Standard candles (left) and standard rulers (right) are two different techniques astronomers used to measure the expansion of space at various times/distances in the past. Based on how quantities like luminosity or angular size change with distance, we can infer the expansion history of the Universe. Standard candles involve looking at objects whose intrinsic brightness is known at all cosmic distances, while standard rulers involve looking at features such as the average separation distance between any two galaxies (imprinted from baryon acoustic oscillations during the early stages of the Big Bang) that evolves as the Universe expands.
Two expansion rate measurement methods yield incompatible values.
The density fluctuations in the cosmic microwave background (CMB) provide the seeds for modern cosmic structure to form, including stars, galaxies, clusters of galaxies, filaments, and large-scale cosmic voids. But the CMB itself cannot be seen until the Universe forms neutral atoms out of its ions and electrons, which takes hundreds of thousands of years, and the stars won’t form for even longer: 50-to-100 million years.
Credit: E.M. Huff, SDSS-III/South Pole Telescope, Zosia Rostomian
The early relic method, via cosmic imperfections, yields 67 km/s/Mpc.
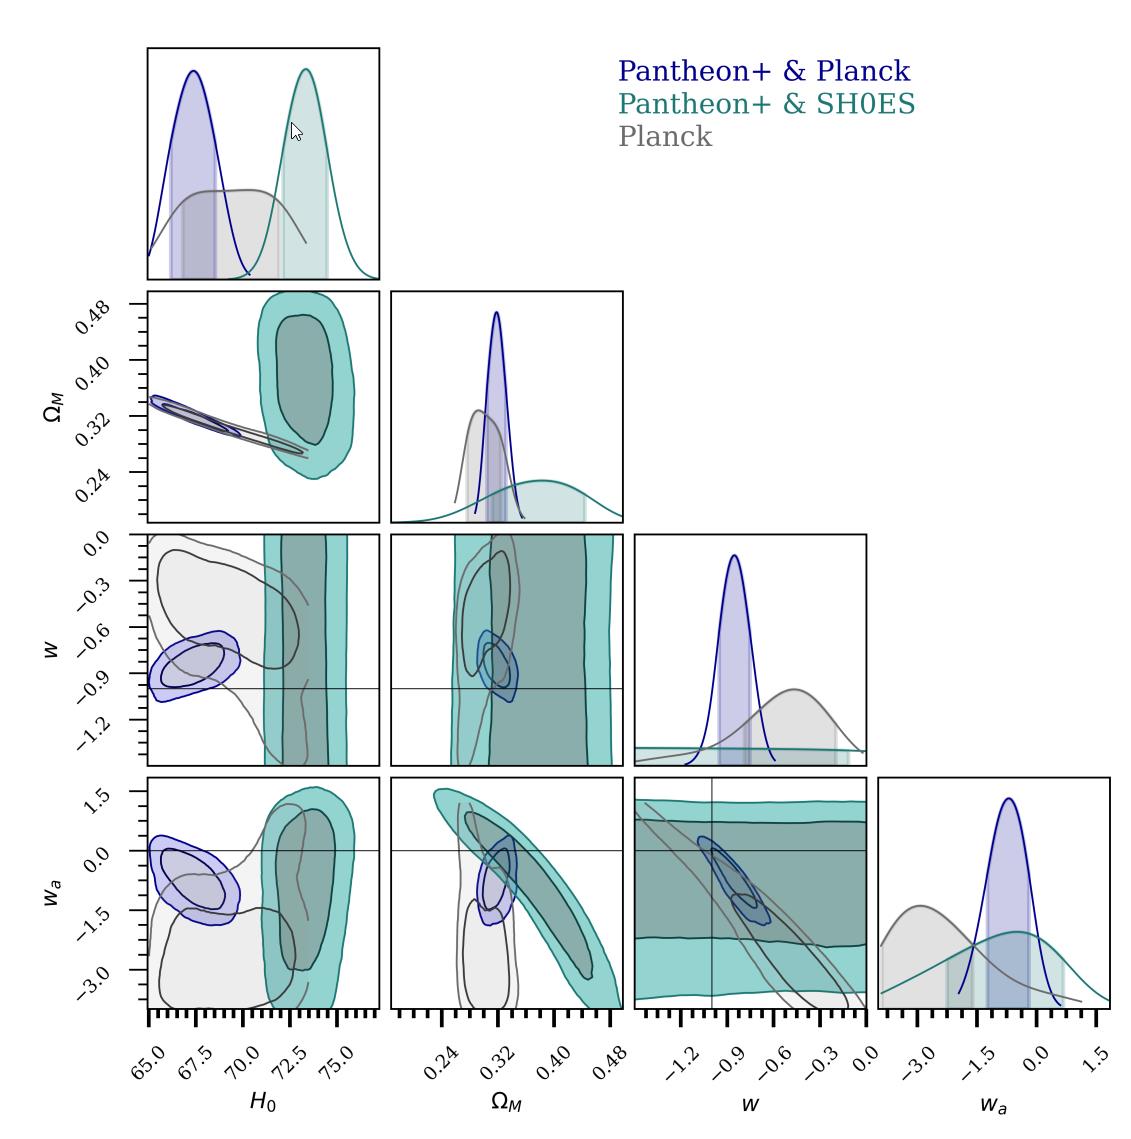
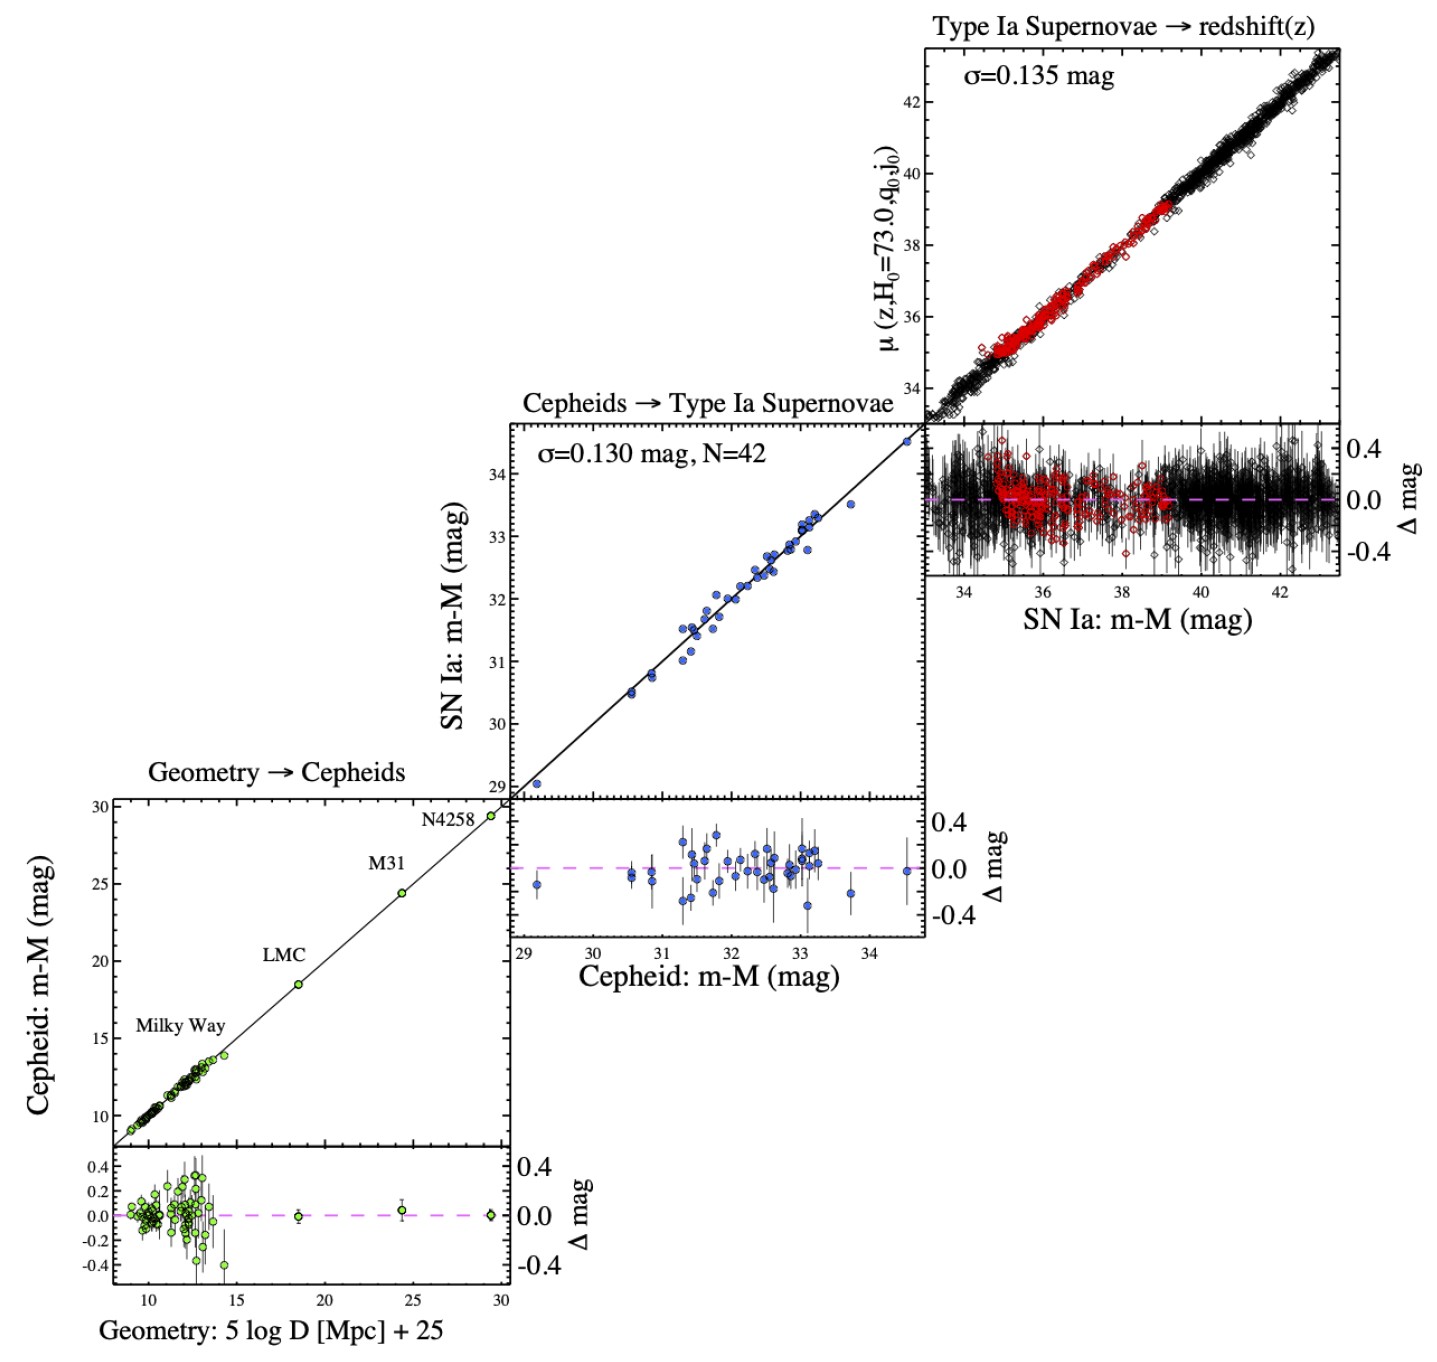
Although there are many aspects of our cosmos that all data sets agree on, the rate at which the Universe is expanding is not one of them. Based on supernovae data alone, we can infer an expansion rate of ~73 km/s/Mpc, but supernovae do not probe the first ~3 billion years of our cosmic history. If we include data from the cosmic microwave background, itself emitted very close to the Big Bang, there are irreconcilable differences at this moment in time, but only at the <10% level!
(Credit: D. Brout et al./Pantheon+, ApJ submitted, 2022)
The distance ladder method, from individually measured objects, yields 73 km/s/Mpc.
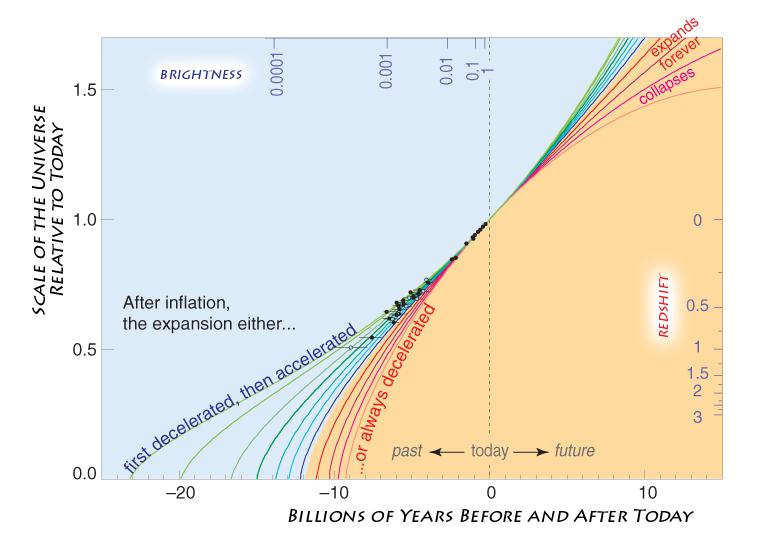
Measuring back in time and distance (to the left of “today”) can inform how the Universe will evolve and accelerate/decelerate far into the future. By linking the expansion rate to the matter-and-energy contents of the Universe and measuring the expansion rate, we can come up with an estimate for the amount of time that’s passed since the start of the hot Big Bang. The supernova data in the late 1990s was the first set of data to indicate that we lived in a dark energy-rich Universe, rather than a matter-and-radiation dominated one; the data points, to the left of “today,” clearly drift from the standard “decelerating” scenario that had held sway through most of the 20th century.
But another cosmic imperfection anomaly is similarly puzzling.
Many different classes of objects and measurements are used to determine the relationship between distance to an object and its apparent speed of recession that we infer from its light’s relative redshift with respect to us. As you can see, from the very nearby Universe (lower left) to distant locations more than 10 billion light-years away (upper right), this very consistent redshift-distance relation continues to hold.
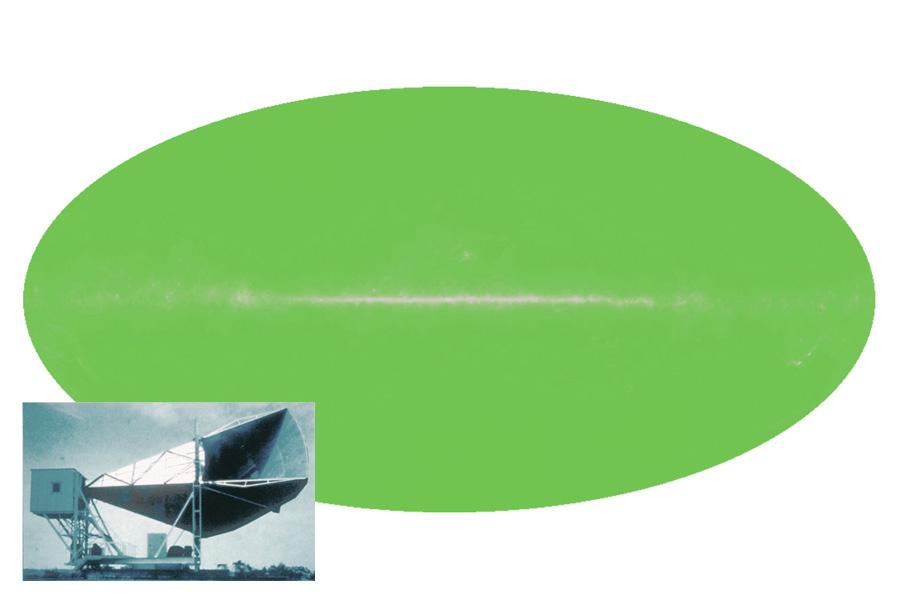
Consider the cosmic microwave background (CMB): leftover radiation from the Big Bang.
According to the original observations of Penzias and Wilson, the galactic plane emitted some astrophysical sources of radiation (center), but above and below, all that remained was a near-perfect, uniform background of radiation. The temperature and spectrum of this radiation has now been measured, and the agreement with the Big Bang’s predictions are extraordinary. If we could see microwave light with our eyes, the entire night sky would look like the green oval shown.
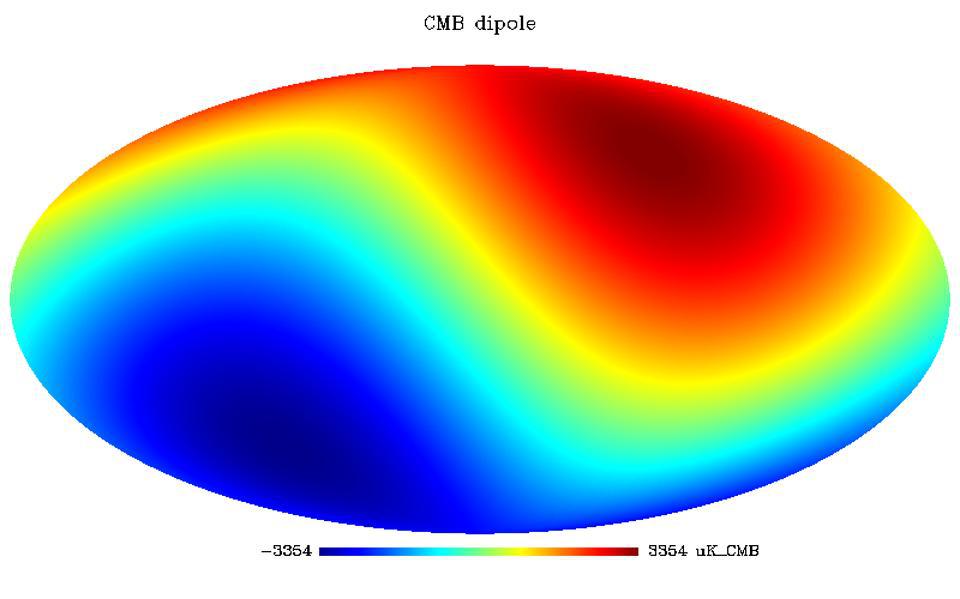
Although mostly uniform, one direction is ~3.3 millikelvin hotter while the opposite is similarly cooler.
Although the cosmic microwave background is the same rough temperature (2.7255 K) in all directions, there are 1-part-in-800 deviations (3.36 millikelvin hotter or colder) in one particular direction: consistent with this being our motion through the Universe. At 1-part-in-800 the overall magnitude of the CMB’s amplitude itself, this corresponds to a motion of about 1-part-in-800 the speed of light, or ~368 km/s from the perspective of the Sun.
This “CMB dipole” reflects our Sun’s relative motion to the CMB: of ~370 km/s.
An accurate model of how the planets orbit the Sun, which then moves through the galaxy in a different direction-of-motion. The distance of each planet from the Sun determines the amount of overall radiation and energy that it receives, but this is not the only factor at play in determining a planet’s temperature. Additionally, the Sun moves through the Milky Way, which moves through the Local Group, which moves through the larger Universe.
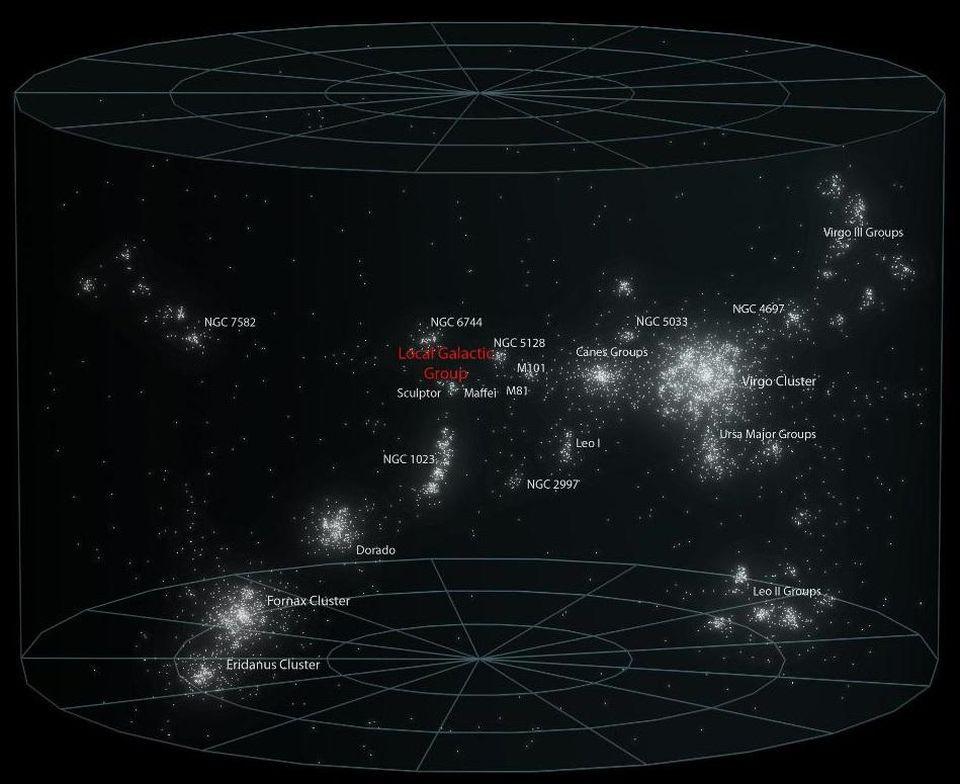
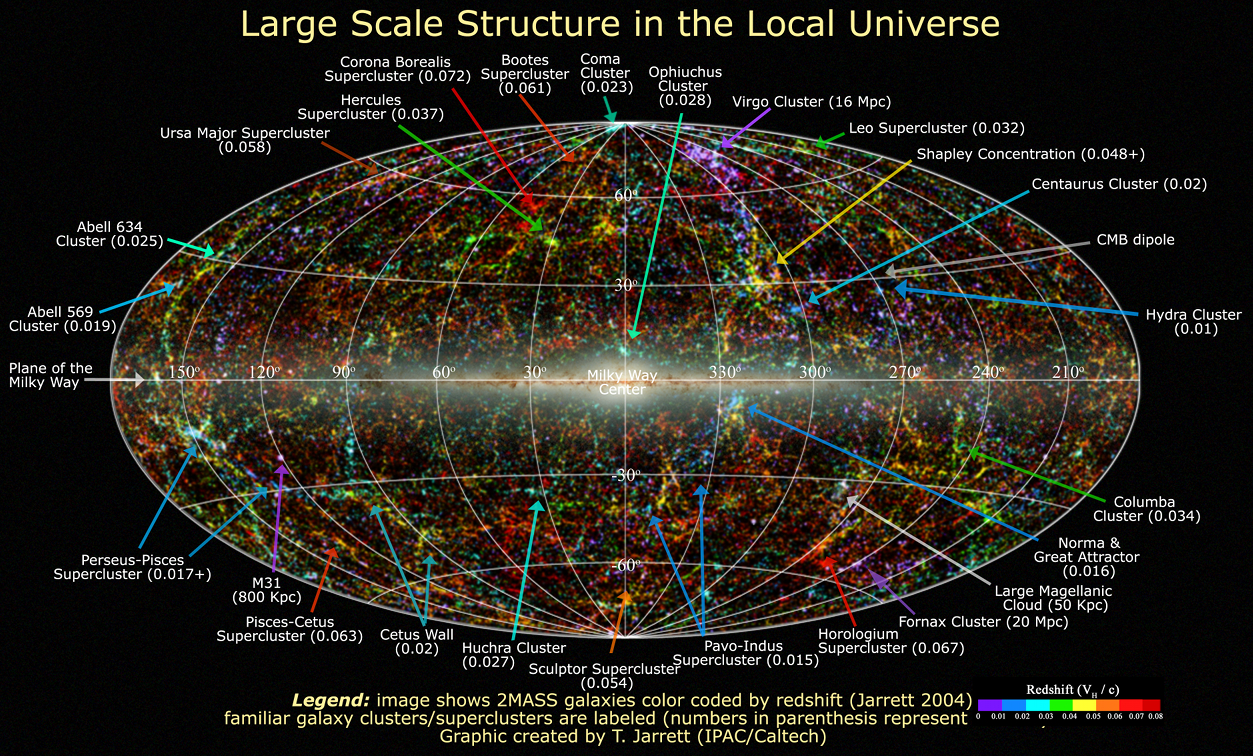
This illustrated map of our local supercluster, the Virgo supercluster, spans more than 100 million light-years and contains our Local Group, which has the Milky Way, Andromeda, Triangulum, and about ~60 smaller galaxies. The overdense regions gravitationally attract us, while the regions of below-average density effectively repel us relative to the average cosmic attraction. However, the individual groups-and-clusters are not gravitationally bound together and are receding from one another as dark energy dominates the cosmic expansion.
This should be due to cosmic, gravitational imperfections tugging on us.
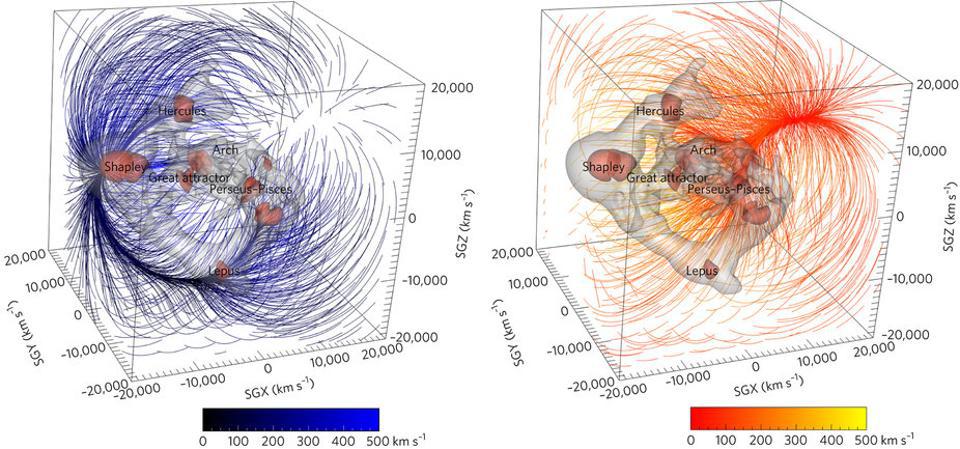
Because matter is distributed roughly uniformly throughout the Universe, it isn’t just the overdense regions that gravitationally influence our motions, but the underdense regions as well. A feature known as the dipole repeller, illustrated here, was discovered only recently and may explain our Local Group’s peculiar motion relative to the other objects in the Universe.
Nearby galaxy motions consistently support this picture.
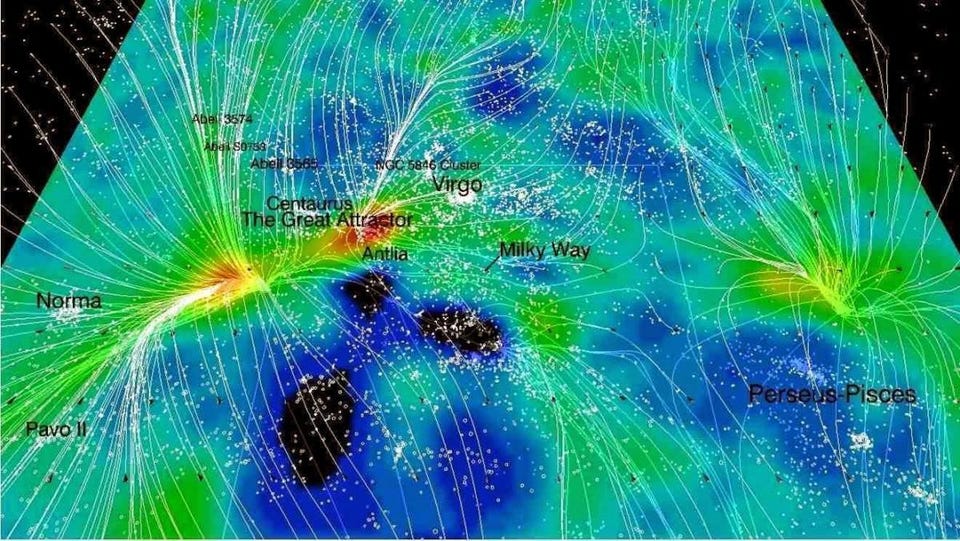
The motions of nearby galaxies and galaxy clusters (as shown by the ‘lines’ along which their velocities flow) are mapped out with the mass field nearby. The greatest overdensities (in red/yellow) and underdensities (in black/blue) came about from very small gravitational differences in the early Universe. Today, a great many nearby galaxies have shifted in position and have had their motions affected by the gravitational effects of matter in their local vicinity, where they depart significantly from the Hubble flow.
Credit: H.M. Courtois et al., Astronomical Journal, 2013
However, more distant motion tracers conflict with it.
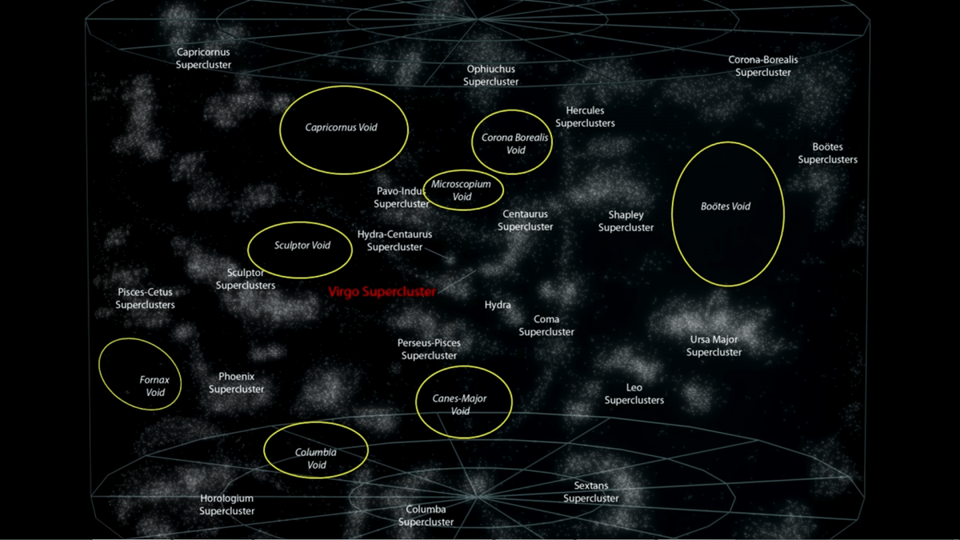
In between the great clusters and filaments of the Universe are great cosmic voids, some of which can span hundreds of millions of light-years in diameter. The long-held idea that the Universe is held together by structures spanning many hundreds of millions of light-years, these ultra-large superclusters, has now been settled, and these enormous web-like features are destined to be torn apart by the Universe’s expansion.
Credit: Andrew Z. Colvin and Zeryphex/Astronom5109; Wikimedia Commons
The Planck satellite’s measurements of the CMB temperature on small angular scales can reveal enhancements or suppressions of temperature by tens of microkelvin induced by the motions of objects: the kinetic Sunyaev-Zel’dovich effect. We can measure this for individual galaxy clusters as well as colliding clusters, and determine the motion of matter within them.
The giant galaxy cluster, Abell 2029, houses galaxy IC 1101 at its core. At 5.5-to-6.0 million light-years across, over 100 trillion stars and the mass of nearly a quadrillion suns, it’s the largest known galaxy of all by many metrics. A survey of the brightest galaxy within all of the Abell clusters reveals a cosmic motion that’s inconsistent with the CMB dipole.
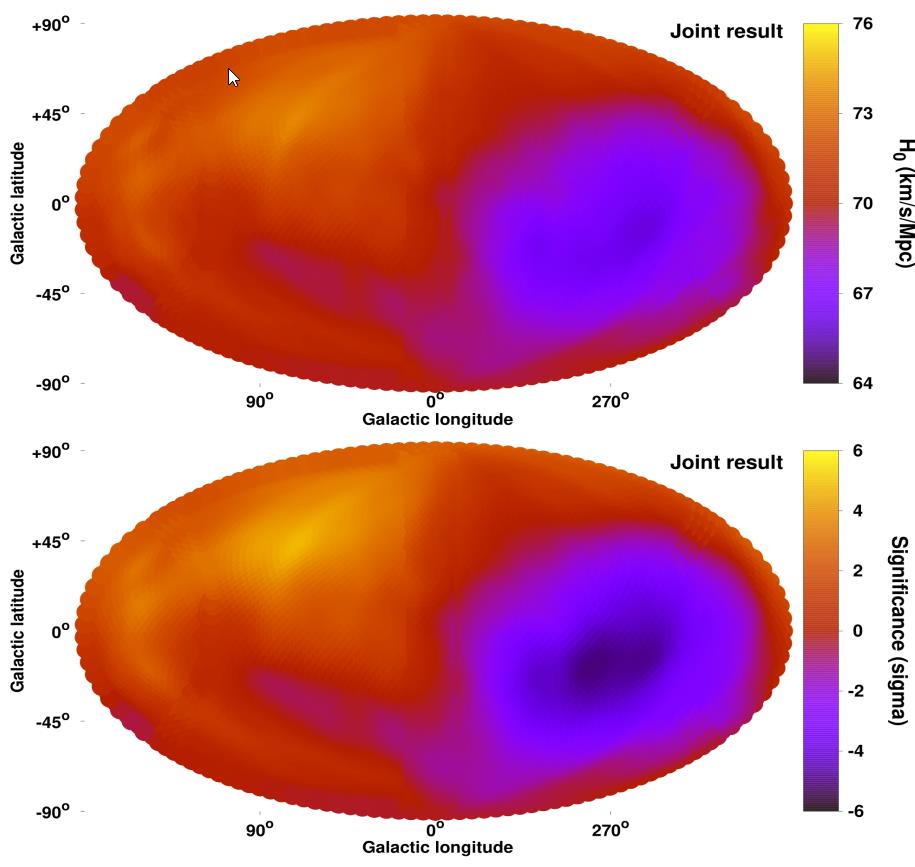
The inferred difference in motions from a variety of properties of galaxy clusters in different directions across the sky, including X-ray, brightest cluster galaxy, and Sunyaev-Zel’dovich effects.
All-sky maps of galaxies reveal that there are more galaxies found at the same brightness/distance thresholds in one direction over another. This so-called Rocket Effect has a predicted amplitude from the dipole seen in the CMB, but what’s observed is more than double the predicted effect.
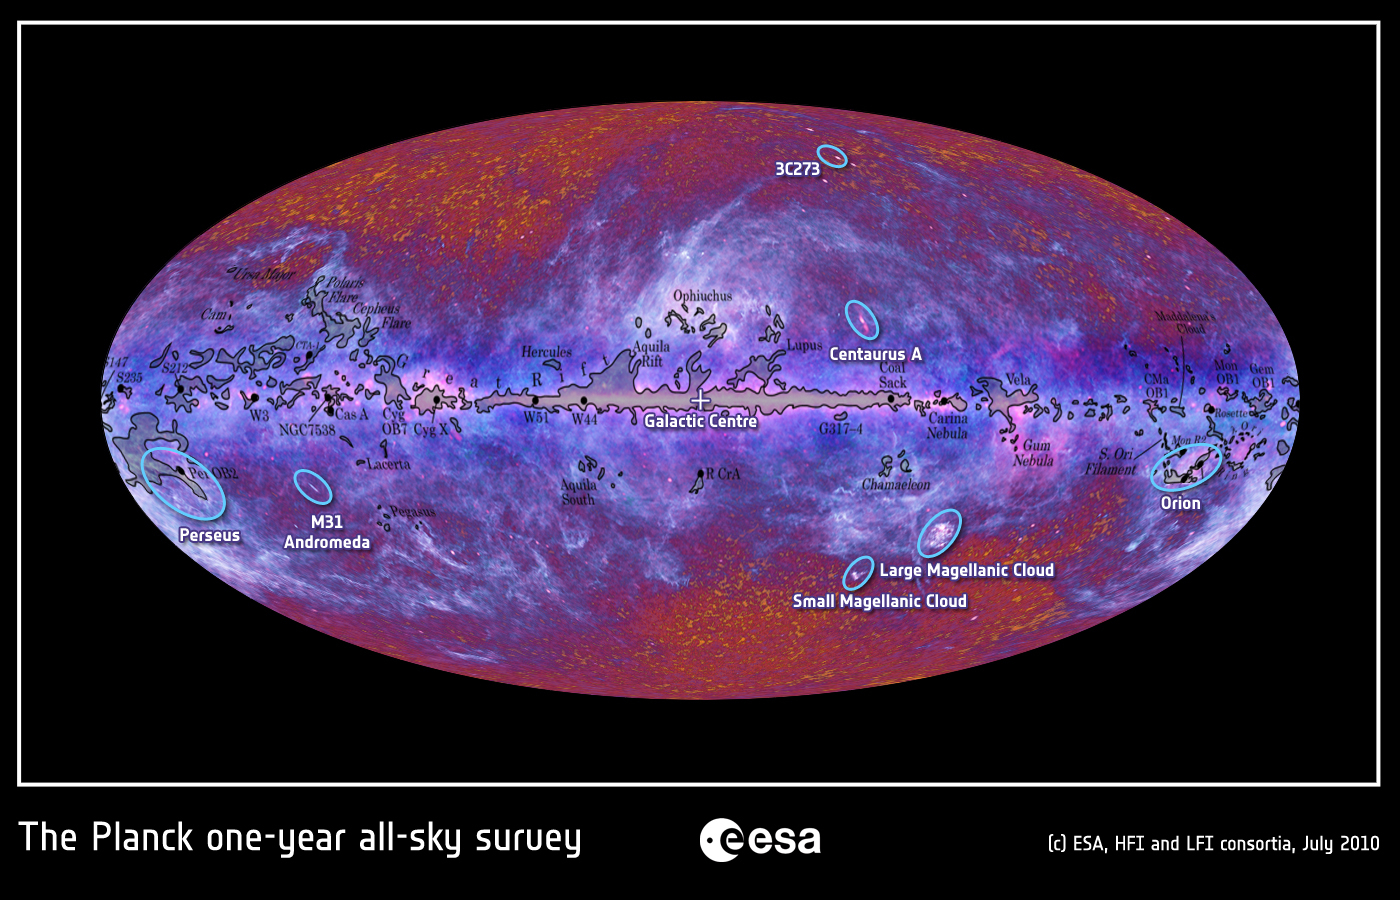
When the entire sky is viewed in a variety of wavelengths, certain sources corresponding to distant objects beyond our galaxy are revealed. This first all-sky map from Planck includes not only the cosmic microwave background, but also extragalactic contributions and the foreground contributions from matter within the Milky Way itself. All of these must be understood to tease out the appropriate temperature and polarization signals.
Credit: ESA, HFI and LFI consortia, 2010; CO map from T. Dame et al., 2001
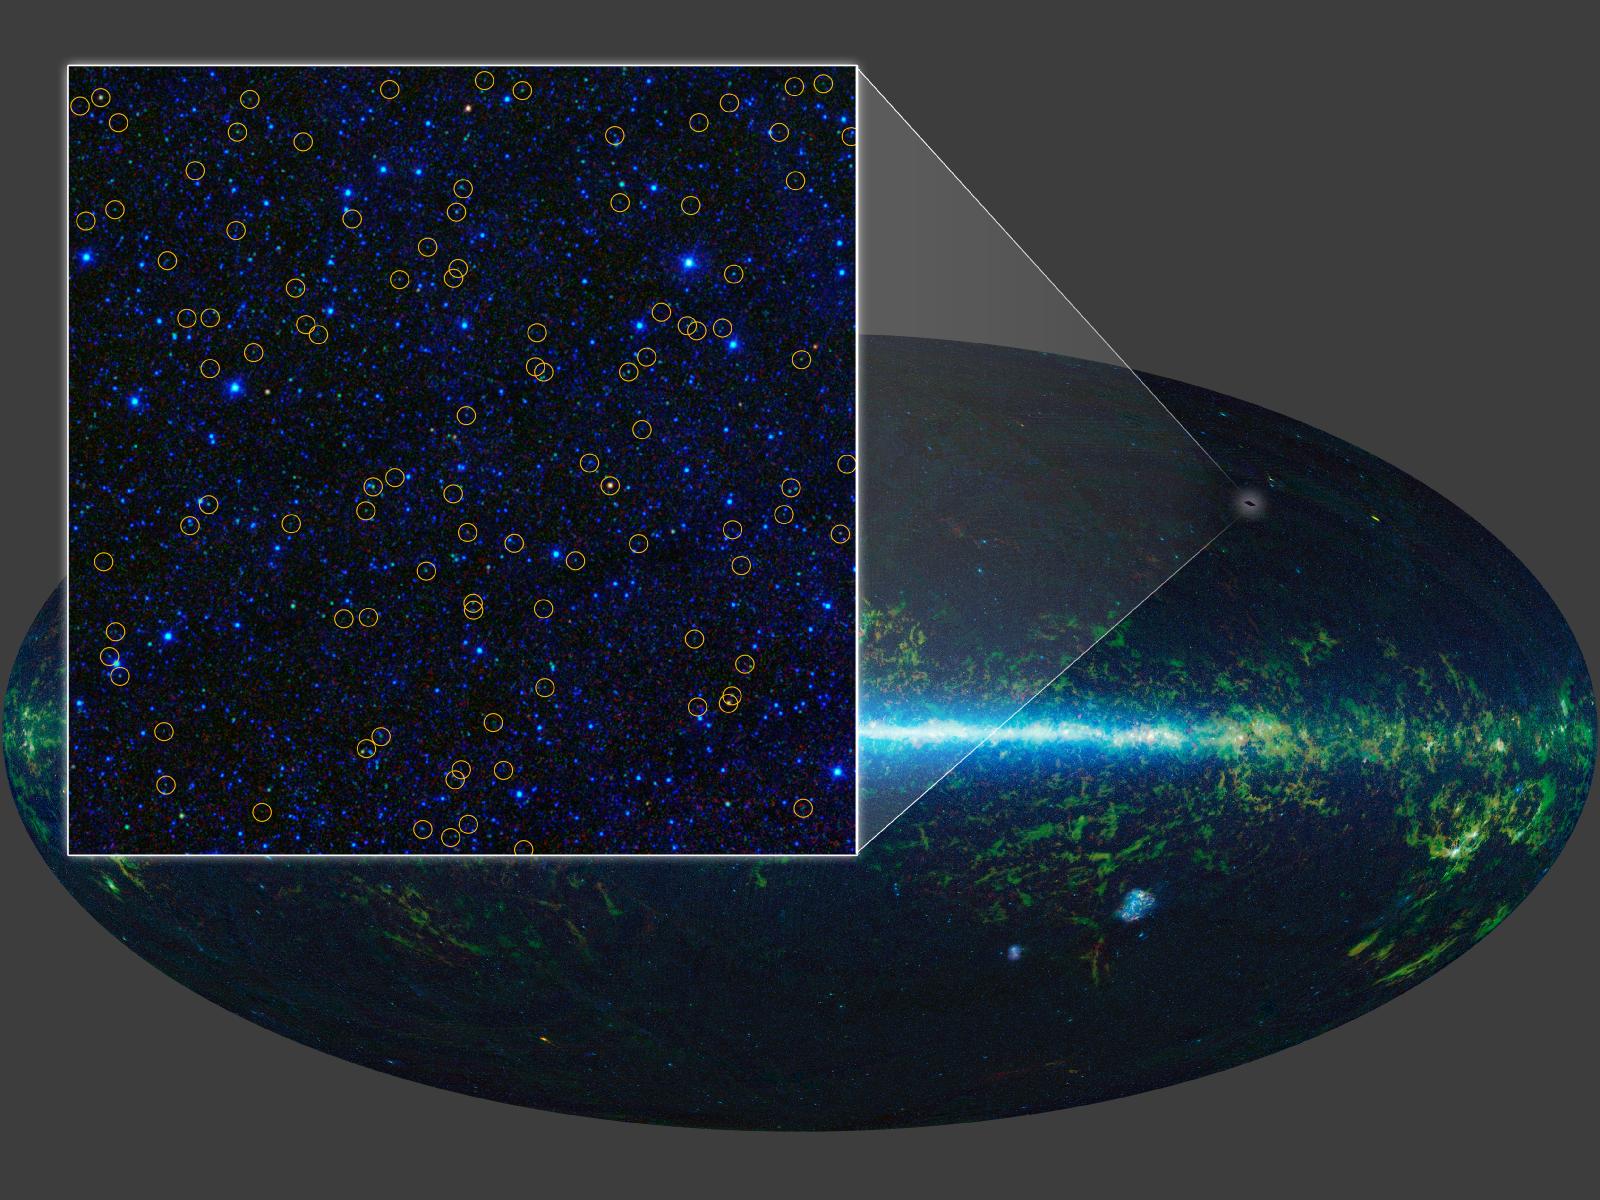
With its all-sky infrared survey, NASA’s Wide-field Infrared Survey Explorer, or WISE, has identified millions of quasar candidates, identified all across the sky (and shown in a small region here) with yellow circles. The clustering of quasars shows an anomalously large signal in terms of one direction having higher quasar counts (and the opposite having lower counts) than expected by a far greater amount than our observed motions lead us to expect.
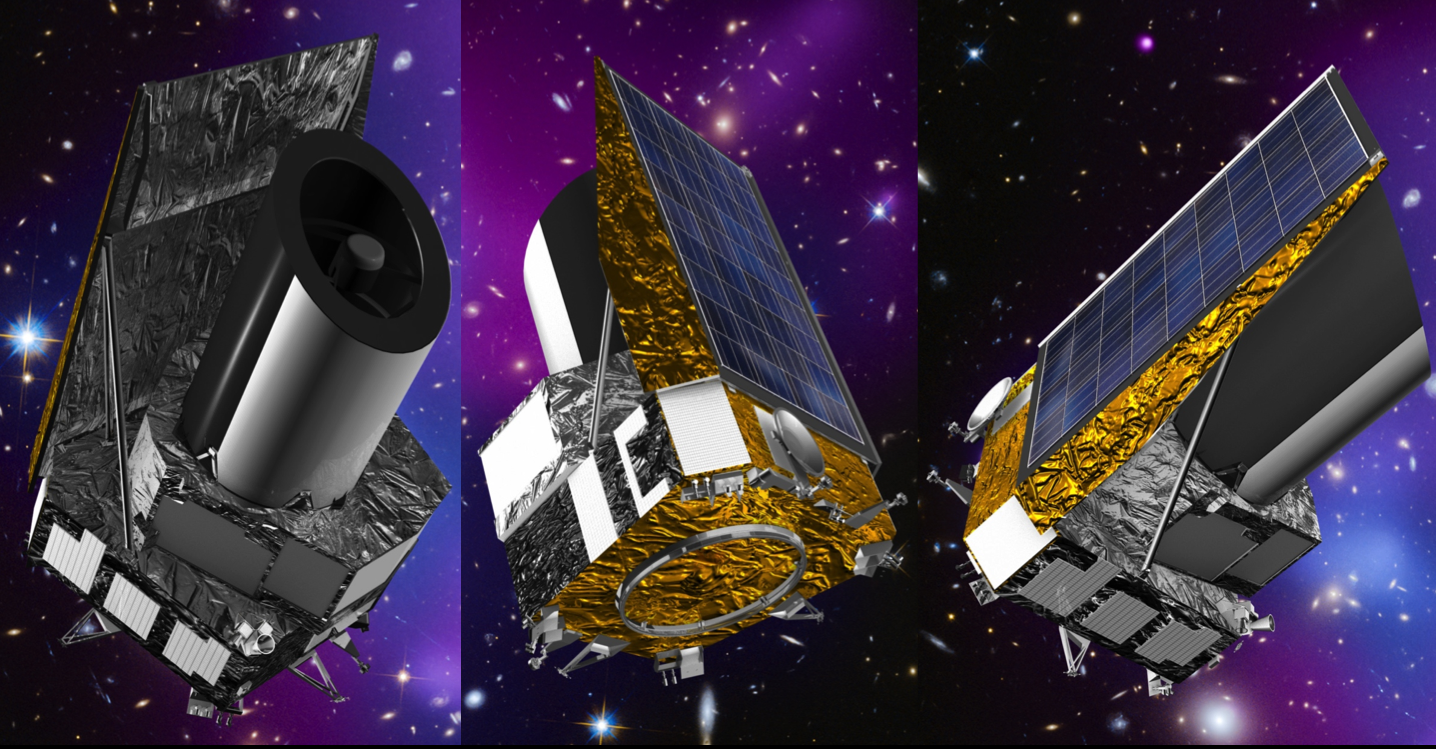
The European Space Agency’s EUCLID mission, scheduled for launch in 2023, will be one of three major endeavors this decade, along with the NSF’s Vera Rubin observatory and NASA’s Nancy Roman mission, to map the large-scale Universe to extraordinary breadth and accuracy.