NASA Kepler’s Scientists Are Doing What Seems Impossible: Turning Pixels Into Planets

Imagine looking at one saturated pixel for years on end, and somehow learning what worlds live around it. That’s what science is for!
When you think of what’s out there in the vast recesses of space, glorious images of galaxies, stars, and new worlds probably leap to mind. A combination of the greatest images from Hubble and some gorgeous artistic renderings are how we visualize the Universe, but that’s not what most telescopes or observatories see, and that’s certainly not where most of the science gets done. NASA’s Kepler mission, famous for discovering thousands of planets outside of our Solar System, never actually images a planet. Instead, they simply image an unresolved star, or more accurately, around 100,000 stars at once. After doing that for weeks, months, or years, they announce the discovery of candidate planets, including properties like their radius and orbital period. A raw image shows nothing but pixels of a saturated star, but it’s what you do with the data that counts. Here’s the science of how a few pixels become an entire solar system.
TRAPPIST-1 is perhaps the most exciting of the recent discoveries made with the Kepler spacecraft. Although it’s a small, low-mass star that’s red and dim, we’ve discovered an incredibly prolific solar system: 7 planets, all of which are approximately Earth-sized, including three that might have the right temperatures and conditions for liquid water on their surface. Best of all, it’s only 40 light years away, meaning that on a galactic scale, it’s right in our own backyard. But when you look at it through NASA’s Kepler telescope, which is where the best data on this planetary system comes from, this is what you see.
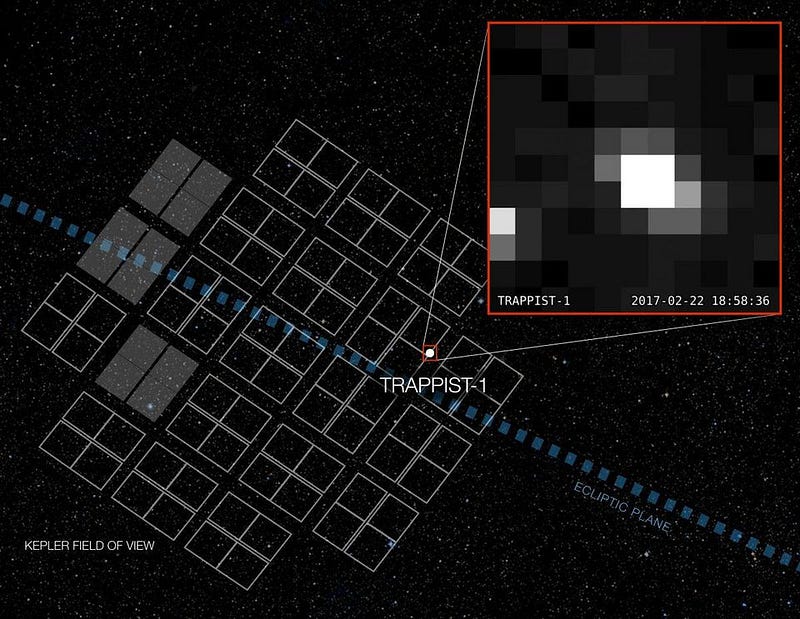
You don’t see planets, you don’t see orbits, you don’t even see anything that tells you about the properties of the star or its solar system. All you see is a set of pixels, indicating you have a light source of some type. There are other light sources nearby — space is a busy place — and Kepler is imaging all of them at once, continuously. Those two facts:
- that Kepler is imaging thousands upon thousands of stars at once,
- and that it’s imaging all of these stars continuously, over long periods of time,
is what enables us to do the incredible science we’re doing. Take a look at this animation of the raw data over an interestingly long period of time.
You’ll notice that the brightness of the star appears to change with time. But you’ll also notice, if you’re careful, that the background brightness of everything else — both other objects and the background “noise” of space itself — changes with time, too. If you’re looking at the raw data itself, there are things you need to know about it before you attempt to make any use of it. There are no corrections for smearing of data across multiple pixels in the raw data. There are no bias subtractions included in the raw data. The field (where there are no stars) isn’t flat, and so this introduces noise into the raw data. There are no flags for the time where the data is of poor quality, such as when the spacecraft’s thrusters fire. And there is no flagging of cosmic rays, which can influence the spacecraft’s software.
Still, when you take all of this into account, the raw data itself (individual red points, below) still shows some remarkable features that are worth looking at.
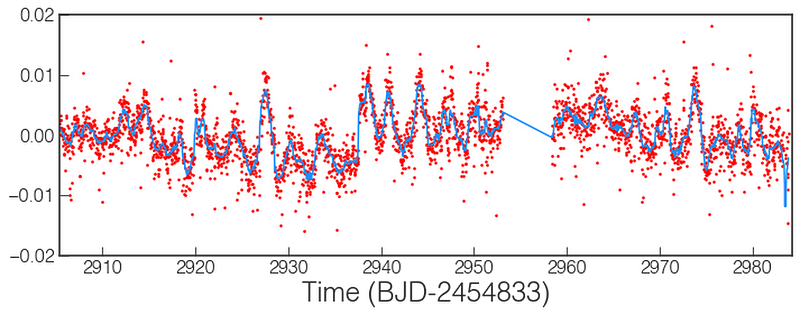
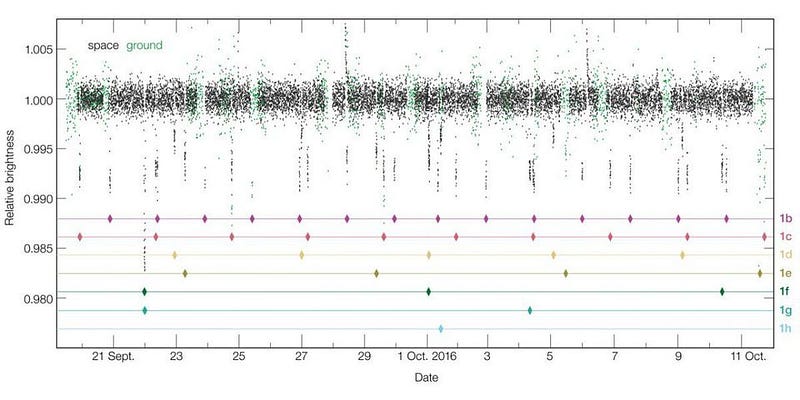
There are sinusoidal (periodioc up-and-down) patterns, which tell you there are sunspots on the main star: some portions of the star are fainter than average. Also, there are a few big dips in the total amount of light in the long-cadence data, where between 0.5% and 1% of the light is temporarily blocked/dimmed over the course of approximately 30 minutes. When you normalize the data and make all the corrections that the raw data doesn’t possess, and then add in follow-up data from other telescopes and observatories, you can clearly see the periodic nature of the planets. When a world transits, or passes in front of the star, it blocks a portion of the light, making the star appear dimmer. Over time, these dips appear periodically, teaching us about the orbits of these worlds.
This gives us all the information we need to deduce many of the properties of these worlds.
- Because we know the size and brightness of the star, we can deduce the radius of each transiting world.
- Because we know the mass of the star and how orbits work, we can figure out the distance of each planet from the star.
- Because we know the temperature of the star, we can figure out which worlds would have the right conditions for liquid water if they had Earth-like atmospheres.
- And because these worlds mutually tug on each other, inducing subtle shifts in one another’s orbits, we can infer what their masses ought to be.
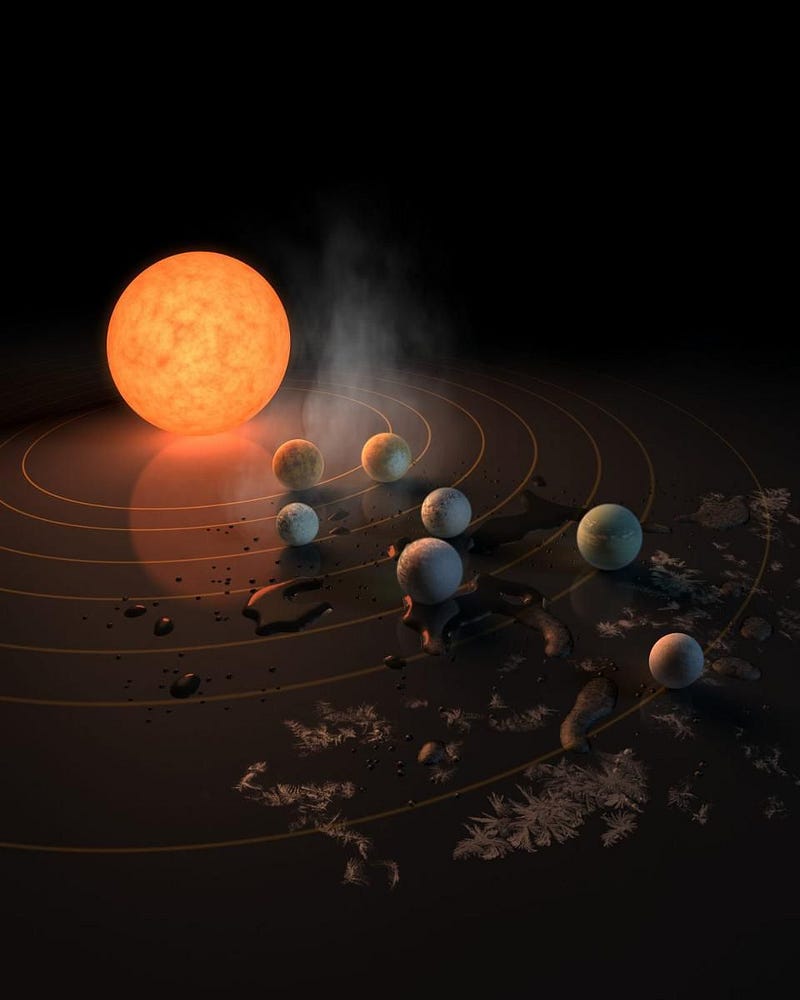
When you put all of this together, here’s how these worlds look, compared to the inner, rocky worlds of our own Solar System.
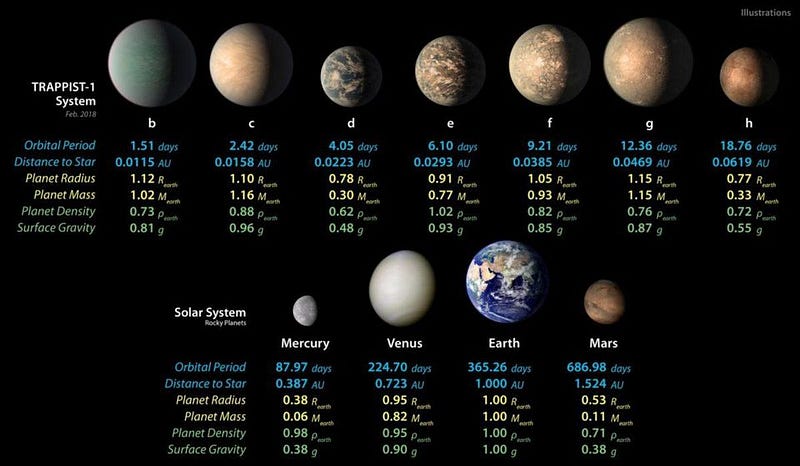
If you’re looking for the most Earth-like world among them all, your best bet is the fourth rock from the star: TRAPPIST-1e. Sure, it’s much closer to its star at just a distance of 3% our distance from the Sun and with an orbital period of 6 days, but its star is much smaller, dimmer and cooler. It’s only 9% smaller than Earth and, within the errors, the same density as our world. You’d weigh 93% of what you’d weigh on Earth on TRAPPIST-1e, as its gravity is almost identical to our own. Most impressively, it has properties consistent with being a dense, rocky world with a thin atmosphere encircling it. Of all the worlds we’ve found orbiting stars beyond the Sun, TRAPPIST-1e, may yet be the most Earth-like of all.
Despite being around a red dwarf and likely locked to its star, the exoplanets orbiting TRAPPIST-1 are incredibly promising for life-giving conditions. They range from roasting to temperate to frozen with sub-surface oceans to potentially light and fluffy, with outer gas envelopes. All of this information — about the worlds around this star, their sizes, their orbits, and even their masses — can all be derived from those tiny, saturated pixels of light that Kepler picked up. And it isn’t just this one system; every star that experiences transits that have been observed by Kepler shows this.
It isn’t the image itself that gives you this information, but rather how the light from image changes over time, both relative to all the other stars and relative to itself. The other stars out there in our galaxy have sunspots, planets, and rich solar systems all their own. As Kepler heads towards its final retirement and prepares to be replaced by TESS, take a moment to reflect on just how it’s revolutionized our view of the Universe. Never before has such a small amount of information taught us so much.
Ethan Siegel is the author of Beyond the Galaxy and Treknology. You can pre-order his third book, currently in development: the Encyclopaedia Cosmologica.