How do we classify the stars in the Universe?
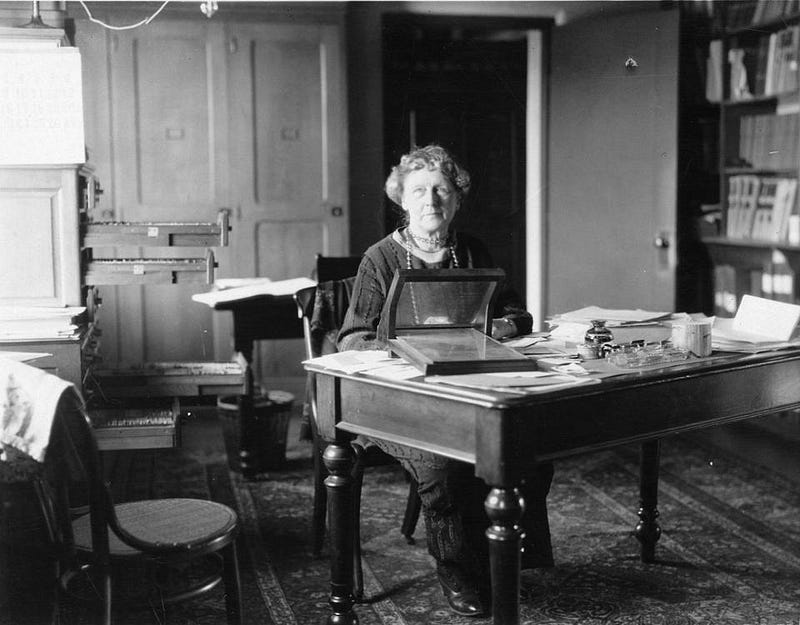
The same way a forgotten woman astronomer — Annie Jump Cannon — first did over 100 years ago!
“Teaching man his relatively small sphere in the creation, it also encourages him by its lessons of the unity of Nature and shows him that his power of comprehension allies him with the great intelligence over-reaching all.”
–Annie Jump Cannon
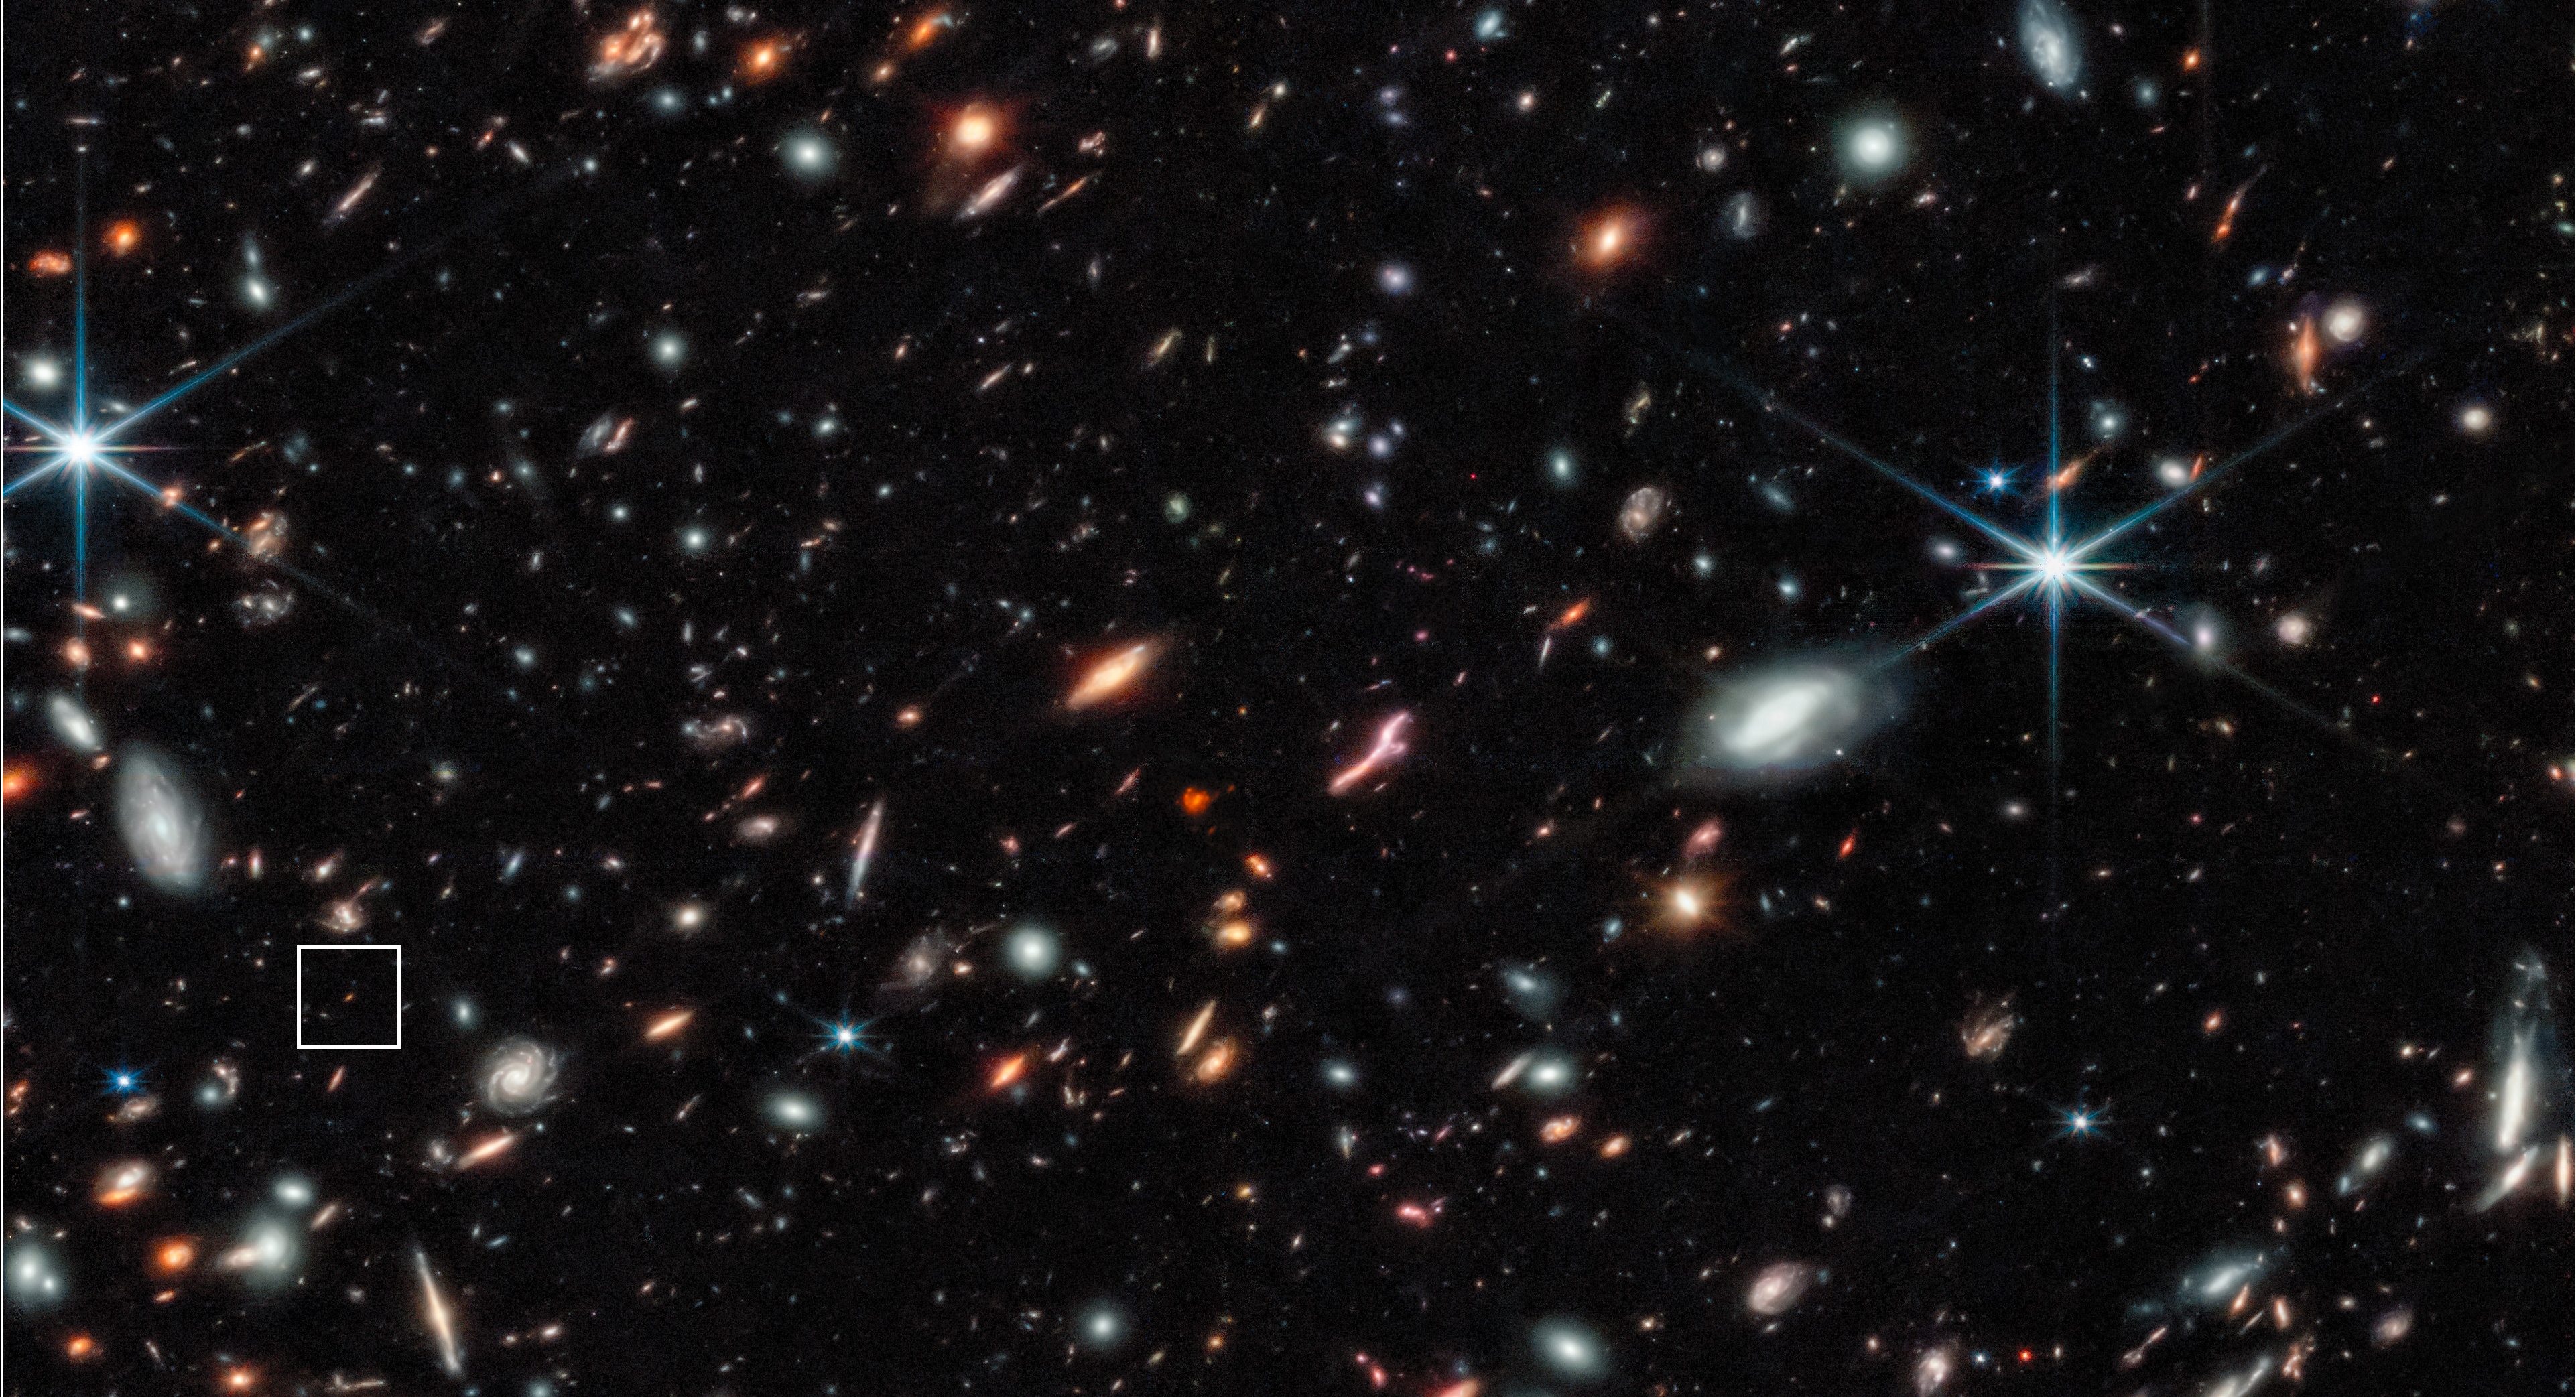
Take a look up at a dark night sky, and you’ll find it illuminated by hundreds or even thousands of individual twinkling points of light. While they might seem, to an untrained eye, to all be the same — except for, perhaps, some appearing brighter than others — a closer look reveals a number of intrinsic differences between them. Some of them appear redder or bluer than others; some are intrinsically brighter or fainter, even if they’re the same distance away; some have larger physical sizes than others; some have greater or lesser percentages of heavy elements in them. For a long time, scientists didn’t know how stars worked or what made one type different from another. Yet at the start of the 20th century, the pieces all came together to figure out exactly how the different stars should be classified, and we owe it all to a woman you might not have heard of: Annie Jump Cannon.
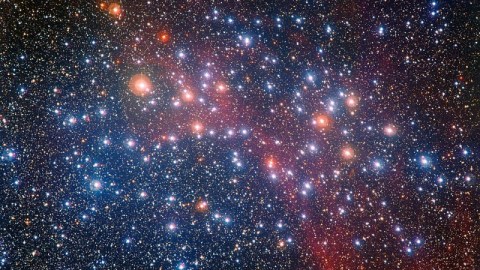
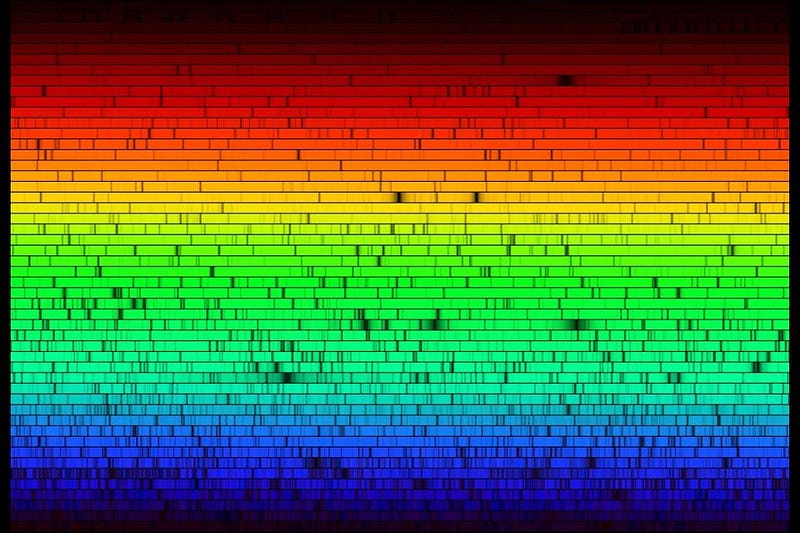
With either good enough skies and a trained observer, or with a quality telescope, a look at the stars immediately shows that they come in different colors. Because temperature and color are so closely related — heat something up and it glows red, then orange, then yellow, white and eventually blue as you turn up the temperature — it makes sense that you’d classify them based on color. But where would you make those divisions, and would those divisions encapsulate all the important physics and astrophysics going on? Without more information, there wouldn’t be a good, universal system that everyone would agree on. But the study of color in astronomy (photometry) can be augmented by breaking up the light into individual wavelengths (spectroscopy). If there are either neutral or ionized atoms in the outermost layers of the star, they’ll absorb some of the light at particular wavelengths. These absorption features can add an extra layer of information, and led to the earliest useful classification system.
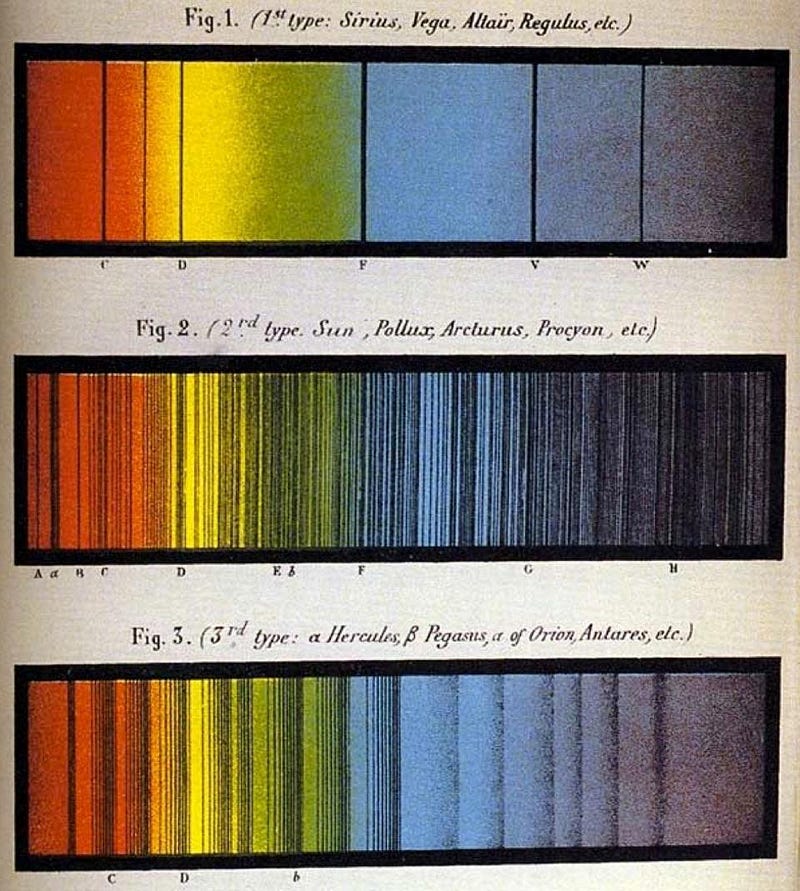
Known as Secchi classes, for the 19th century Italian astronomer Angelo Secchi who devised them, there were originally three types:
- Class I: a class for the blue/white stars that exhibited strong, broad hydrogen lines.
- Class II: yellow stars with weaker hydrogen features, but with evidence of rich, metallic lines.
- Class III: red stars with complex spectra, with huge sets of absorption features.
This system, first laid out in 1866, was the first non-arbitrary system of classification, since it relied on a combination of spectroscopic features in tandem with the photometric colors. While Secchi went on to further refine his class structure and introduce sub-classes and additional classes, this became superseded by finer spectral delineations.
Researchers at Harvard College Observatory were tasked with surveying all the stars visible in the night sky down to a visual magnitude of +9, or the faintest you’d be able to see today with a very nice pair of binoculars. Except it wasn’t enough to record them in the traditional fashion; they needed to be observed and analyzed spectroscopically. Under the guidance of Edward Pickering, a group of astronomers — all women, known at the time as “Pickering’s Harem” (that was later sanitized to “Pickering’s Women” or the “Harvard Computers”) — took the data and created the Draper System, for which Pickering was given sole/full credit.
The stars that had the strong hydrogen lines (Secchi Class I) were broken up into four further delineations, labeled A through D, based on how strong the hydrogen absorption features were, with A being the strongest. The stars with rich, metallic lines (and weaker hydrogen lines, Secchi Class II) were broken up into six classes, E through L, with decreasing hydrogen strength and increasing metal strength going hand-in-hand. The reddest stars, richest in absorption features (Secchi Class III) became class M. In addition, there were four other types labeled N through Q, with O being notable as having very bright, blue stars with very weak hydrogen features, but also lines not seen in any other star class.
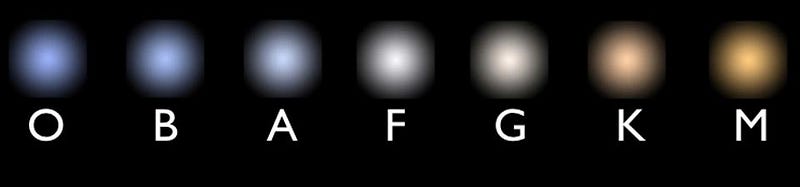
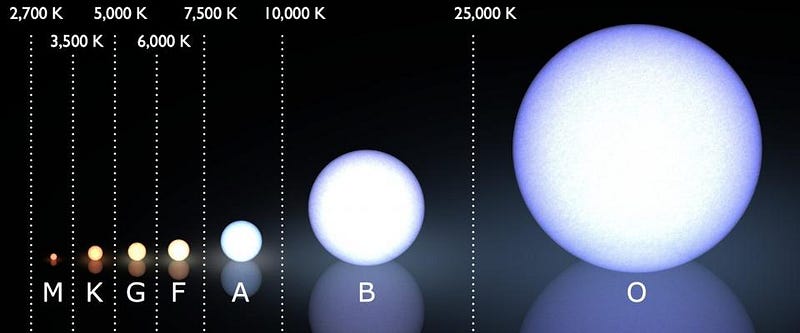
In 1901, Annie Jump Cannon — one of the astronomers working under Pickering — synthesized the full suite of this data and consolidated the seventeen Draper System classes into just seven: A, B, F, G, K, M, and O. The big step that she took, however, was also perhaps the simplest: to reorder them by their color, from bluest to reddest. This meant the order was now O, B, A, F, G, K, and M. Star types were further broken down into ten intervals apiece, from 0 to 9, based on bluest to reddest. So a B2 star would be 20% of the way between a B0 star and an A0 star, a B5 star would be 50% of the way there, and a B9 star would be 90% of the way there. The bluest star of all would be O0, while the reddest would be M9. This system, known as the Harvard Spectral Classification System, is still in use today. There would, however, be one more great leap that would happen decades after Annie Jump Cannon’s contributions, and you can see it for yourself if you view the spectra of these different classes in descending order.
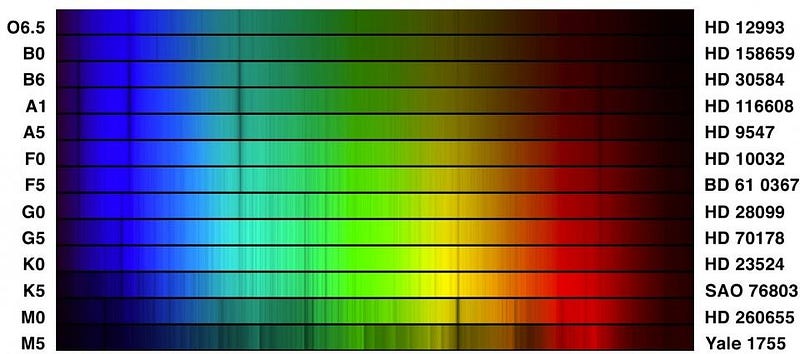
You’ll notice that certain lines appear, get stronger and then disappear, while others simply appear and strengthen. The reason stars appear with the absorption features they do are because of their temperature, and because at certain temperatures different ionization states (and hence, different atomic transitions) are more common, and therefore, stronger. The link between temperature, color and ionization wasn’t found until 1925, with the Ph.D. dissertation of Cecilia Payne, which also enabled us to determine what the Sun (and all stars) were actually made out of! The different stellar classifications don’t just correspond to a star’s colors and absorption features, but to a star’s temperature as well.
Thanks to Payne and Cannon’s work, we learned that stars were made out of mostly hydrogen and helium, and not out of heavier elements like Earth is. Cecilia Payne’s work would have been impossible without Annie Jump Cannon’s data; Cannon herself was responsible for classifying, by hand, more stars in a lifetime than anyone else: around 350,000. She could classify a single star, fully, in approximately 20 seconds, and used a magnifying glass for the majority of the (faint) stars. Her legacy is now nearly 100 years old: on May 9, 1922, the International Astronomical Union formally adopted Annie Jump Cannon’s stellar classification system. With only minor changes having been made in the 94 years since, it is still the primary system in use today.
This post first appeared at Forbes, and is brought to you ad-free by our Patreon supporters. Comment on our forum, & buy our first book: Beyond The Galaxy!