Ask Ethan: How Does The CMB Reveal The Hubble Constant?
We have two ways of measuring the expansion rate. Here’s the harder one.
If you want to understand where our Universe came from and where it’s going, you need to measure how it’s expanding. If everything is moving away from everything else, we can extrapolate in either direction to figure out both our past and our future. Go backwards, and things will get denser, hotter, and less clumpy. If you know the expansion rate now and what’s in your Universe, you can go all the way back to the Big Bang. Similarly, if you know the expansion rate now and how it’s changing over time, you can go all the way forward to the heat death of the Universe. But one of cosmology’s biggest puzzles is that we have two completely different methods for measuring the Universe’s expansion rate, and they don’t agree. How do we even get those rates? That’s what Lindsay Forbes (no relation) wants to know, asking:
“The Cosmic Microwave Background (CMB) is a very important part of the Big Bang model. How do they calculate H0 from the CMB? I get the [supernova] group. I can see how the recent parallax measurements help to support their observations. I just can’t understand how the [other] group gets from those little dots on the CMB map to what we see now in the sky.”
It’s a very deep question, and one that deserves a good answer. Let’s go into detail and find out.
There are all sorts of measurements we can make about the Universe that reveal its properties. If we want to know how quickly the Universe is expanding, all you need is the right picture in your head. The Universe starts off very hot, dense, and uniform. As it ages, it expands; as it expands, it gets:
- cooler (because the radiation in it gets stretched in wavelength, shifting it towards lower energies and temperatures),
- less dense (because the number of particles in it stays constant, but the volume increases),
- and clumpier (because gravity pulls more matter into the denser regions, while preferentially stealing matter away from the less-dense regions).
As all of these things happen, the expansion rate also changes, getting smaller with time. There are many different ways to go about measuring the expansion rate of the Universe, but they all fall into two categories: what I call the “distance ladder” method and what I call the “early relic” method.
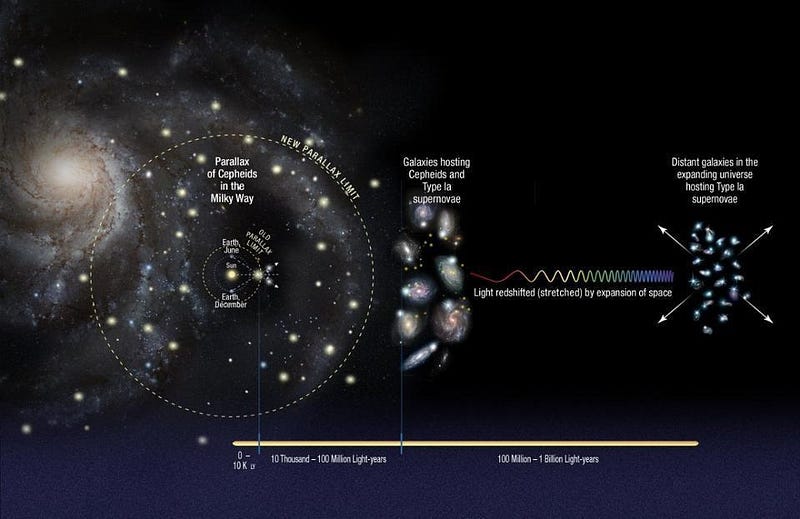
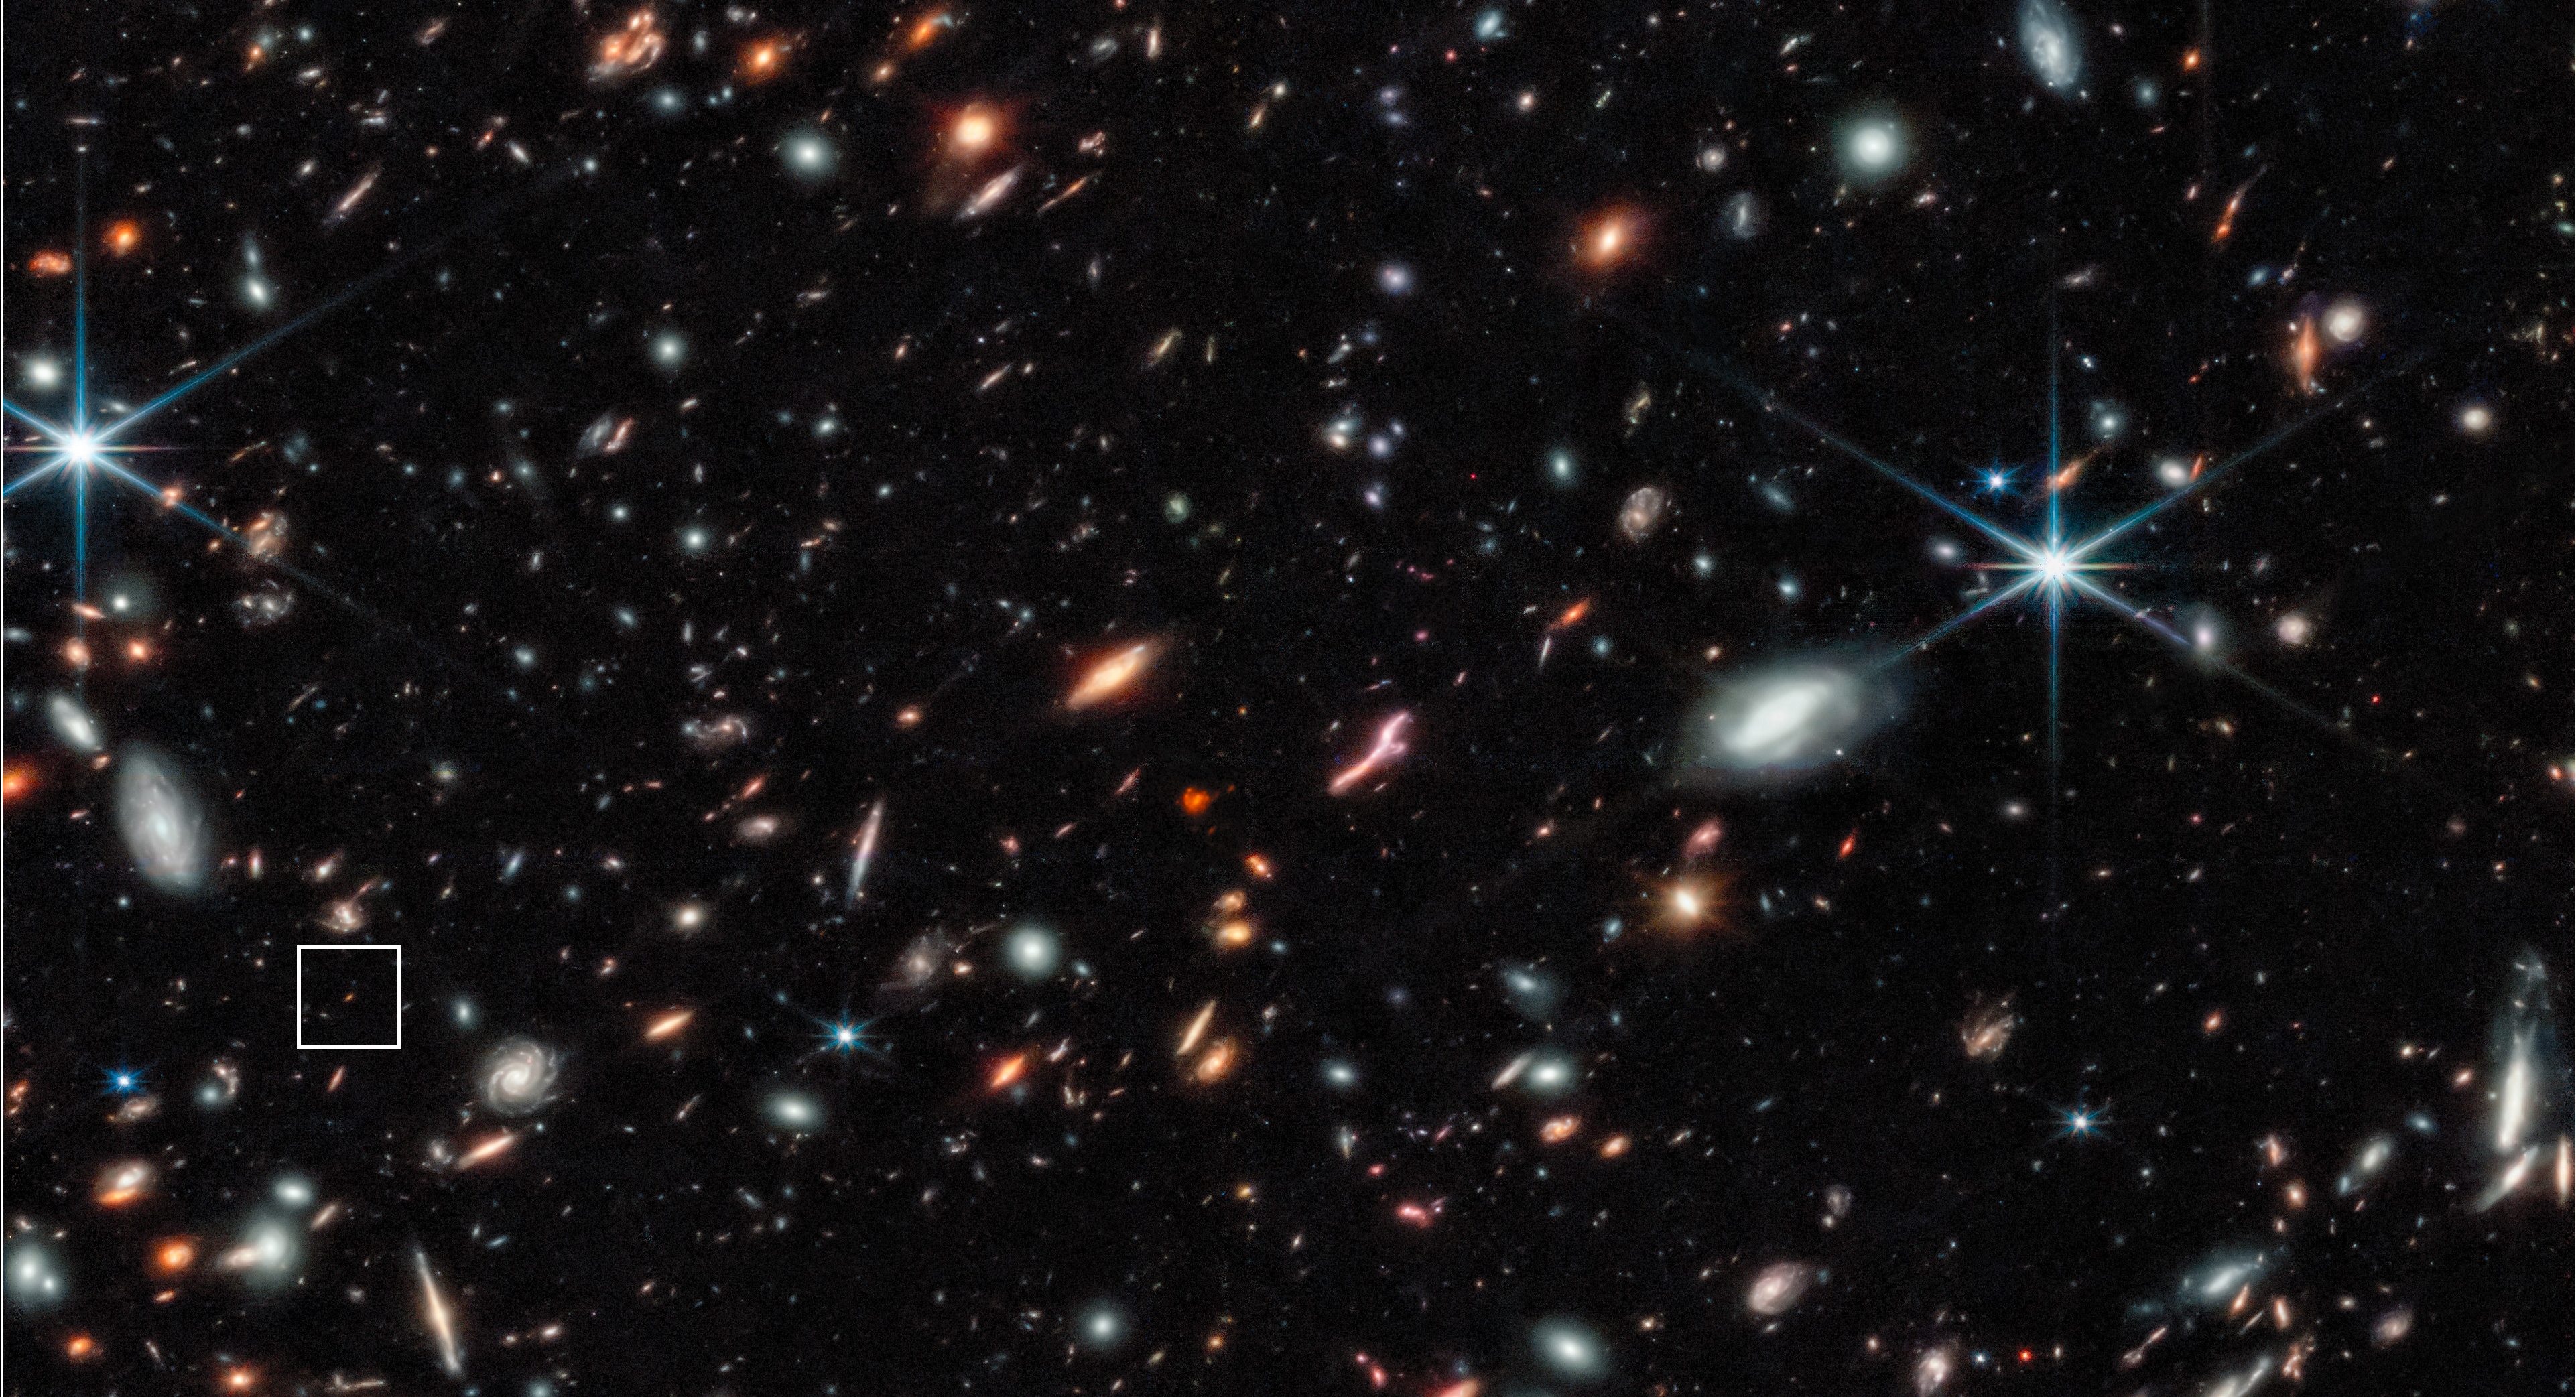
The distance ladder method is easier to understand. All you’re going to do is measure objects that you understand, determining both their distance from you and how much the light from them gets shifted by the expansion of the Universe. Do this for enough objects at a variety of distances — including large enough distances — and you’ll reveal how quickly the Universe is expanding, with very small errors and uncertainties.
At this point, there are many different ways of doing this. You can measure individual stars directly, determining their distance simply by measuring them throughout the year. As the Earth moves around the Sun, that tiny change in distance is enough to reveal how much the stars shift by, the same way your thumb shifts relative to the background if you close one eye and then switch eyes.
Once you know how far away those types of stars are — Cepheids, RR Lyrae, certain types of giant stars, etc. — you can look for them in distant galaxies. Because you know how these stars work, you can determine their distances, and therefore the distances to those galaxies.
Then, you can measure properties of those galaxies or objects within those galaxies: rotation properties, velocity dispersions, surface brightness fluctuations, individual events like type Ia supernovae, etc. As long as you can measure the properties you’re seeking, you’ll be able to build a cosmic distance ladder, determining how the Universe has expanded between the time the light was emitted from your distant objects and when it arrived at your eyes.
The early relic methods, as a group, are more complicated in detail, but not necessarily more complicated as a concept. Instead of starting here on Earth and working our way out, deeper and deeper into the distant Universe, we start way back at the Big Bang, and calculate some initial imprint at some stupendously early time. We then measure a signal that’s observable today that’s affected in a specific way by that early imprint.
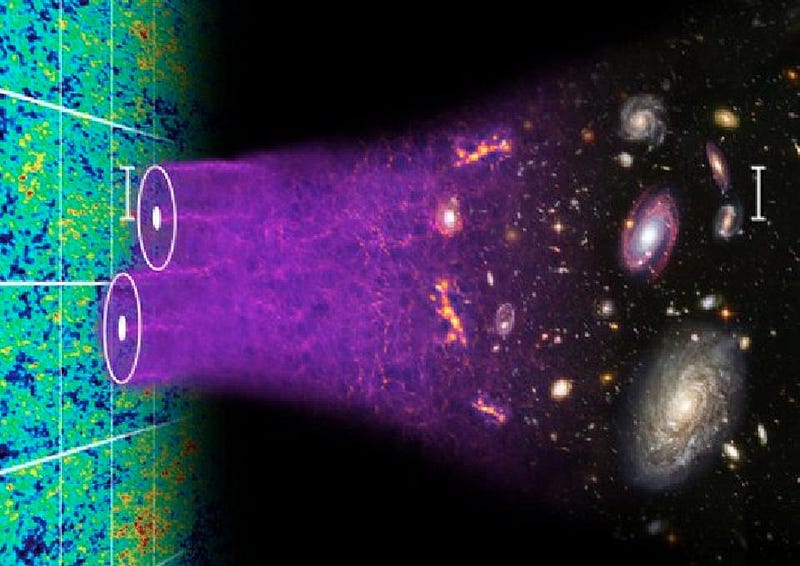
What’s changed? The Universe has expanded from the Big Bang to the present day. When we measure that imprint today, we can learn how the Universe expanded from the moment that early relic was imprinted to right now, when we measure it. The two most famous “early relic” methods both come from the same source: those initially overdense and underdense regions that provided the seeds for the growth of large-scale structure in the Universe. They show up in the large-scale clustering of galaxies we see in the late-time Universe, and they also show up in the leftover glow from the Big Bang: the Cosmic Microwave Background, or the CMB.
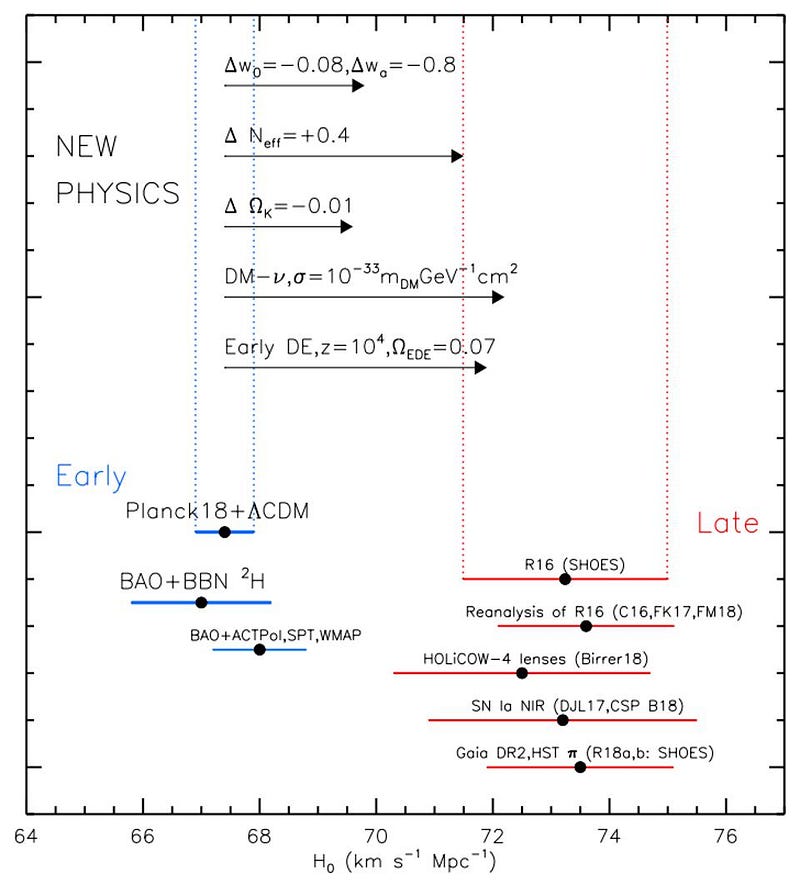
What you’d hope for — indeed, what almost every astrophysicist and cosmologist hoped for — was that no matter how we went out to measure the expansion rate of the Universe, we’d get precisely the same answer. In the late 1990s/early 2000s, we thought we had finally pinned it down. The so-called Key Project from the Hubble Space Telescope, named because it’s goal was to measure the Hubble constant, returned their main results: the Universe was expanding at 72 km/s/Mpc, with an uncertainty of about 10%. But since that 2001 release, these various methods have beaten those uncertainties down further.
This is why there’s such a controversy in cosmology today, by the way: because within the distance ladder class, all the measurements appear to converge on a value that’s 73–74 km/s/Mpc, but within the early relic class, all the measurements appear to converge on a value that’s 67–68 km/s/Mpc. The uncertainties on these values are about 1–2% each, but they differ by about 9% from one another. Unless something is fundamentally wrong with one of these classes of measurement or there’s some type of physics we aren’t accounting for, this mystery isn’t really going anywhere anytime soon.
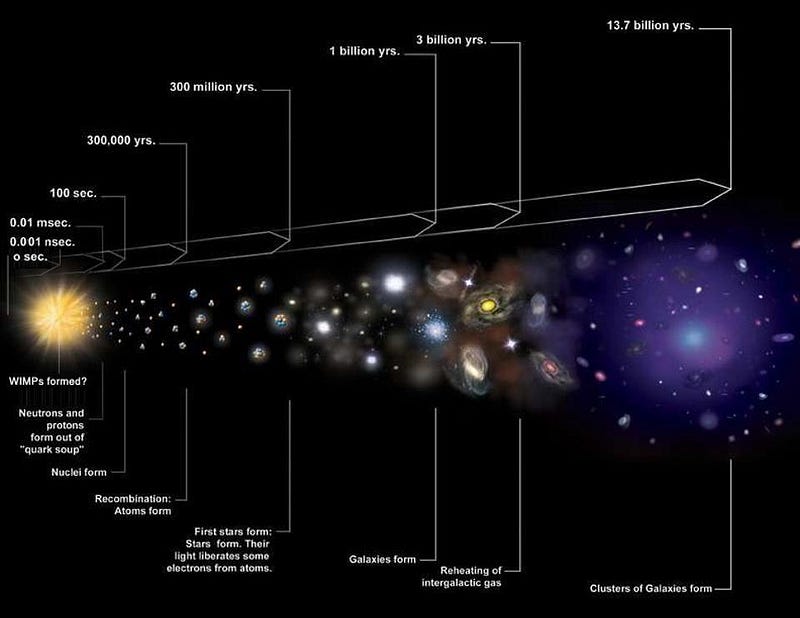
If we want to understand where that CMB value comes from, you have to understand what the CMB is and what it’s telling us. The early Universe was hot and dense: so hot and so dense that, at some point long ago, it wasn’t possible to form neutral atoms. Anytime a proton or any atomic nucleus encountered an electron, the electron would attempt to bind to it, cascading down the various energy levels and emitting photons.
But if your Universe is too hot, there are going to be photons that are energetic enough to kick those electrons right back off again. It’s only once the Universe has had enough time to expand and cool, and all the photons in it have cooled (on average) to below a certain temperature, that you can form those neutral atoms. At that point, when the neutral atoms form, those photons stop bouncing off of the free electrons — because there are no more free electrons; they’ve all been bound up in neutral atoms — and that light simply does what it does: travel in a straight line at the speed of light until it hits something.
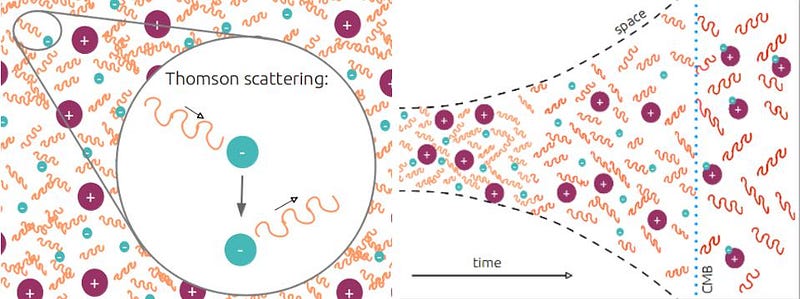
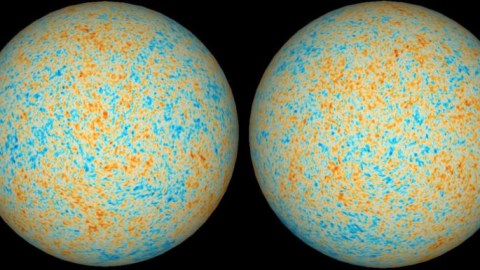
Of course, most of that light hasn’t hit anything, because space is mostly empty. When we look out at the sky today, we see that leftover light, although we don’t see it exactly as it was when it was released by those neutral atoms. Instead, we see it as it is today, after journeying through the expanding Universe for some 13.8 billion years. It was about 3,000 K in temperature when the Universe first became neutral; it’s cooled down to 2.7255 K today. Instead of peaking in the visible part of the spectrum or even the infrared part, the light has shifted so severely it now appears in the microwave portion of the spectrum.
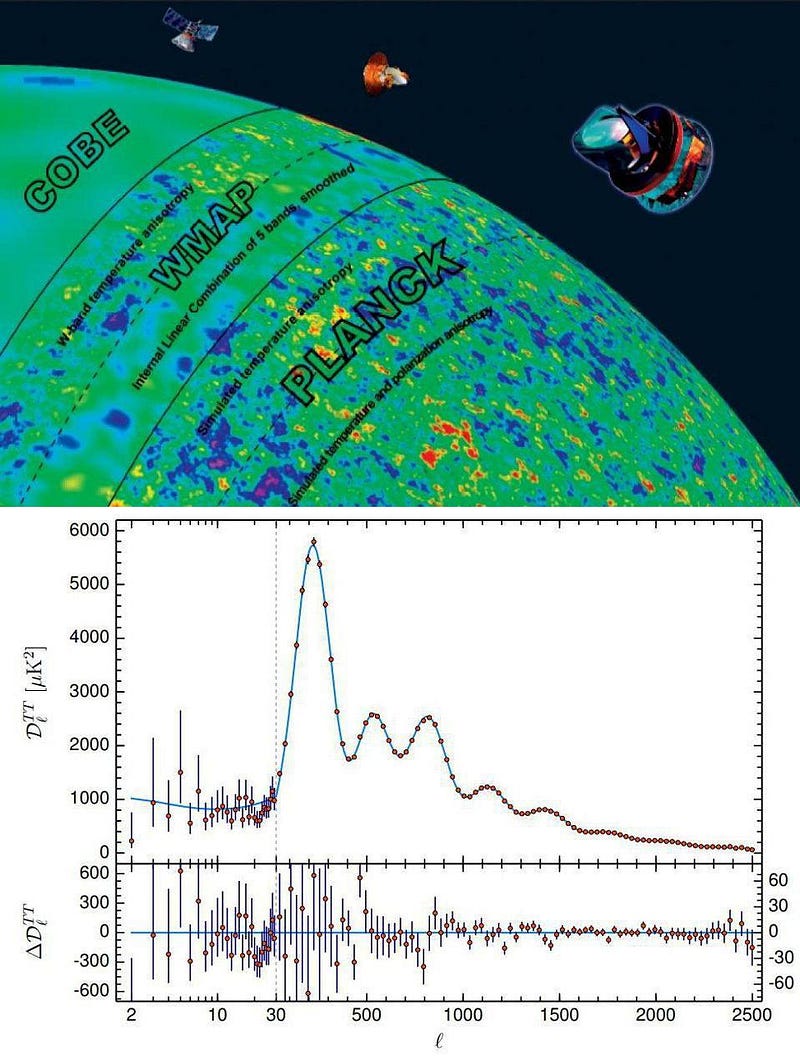
That 2.7255 K is the same everywhere: in all directions that we look. At least, it’s approximately the same everywhere. We’re moving through the Universe relative to this background of light, causing the direction we’re moving in to appear hotter and the direction we’re moving away from to appear colder. When we subtract that effect out, we discover that down at about the 0.003% level — temperature differences of only tens or hundreds of micro-degrees — there are temperature fluctuations: places that are ever so slightly hotter or colder than average.
This is the crux of the big question: how do we get the expansion rate from these measurements of temperature and temperature fluctuations?
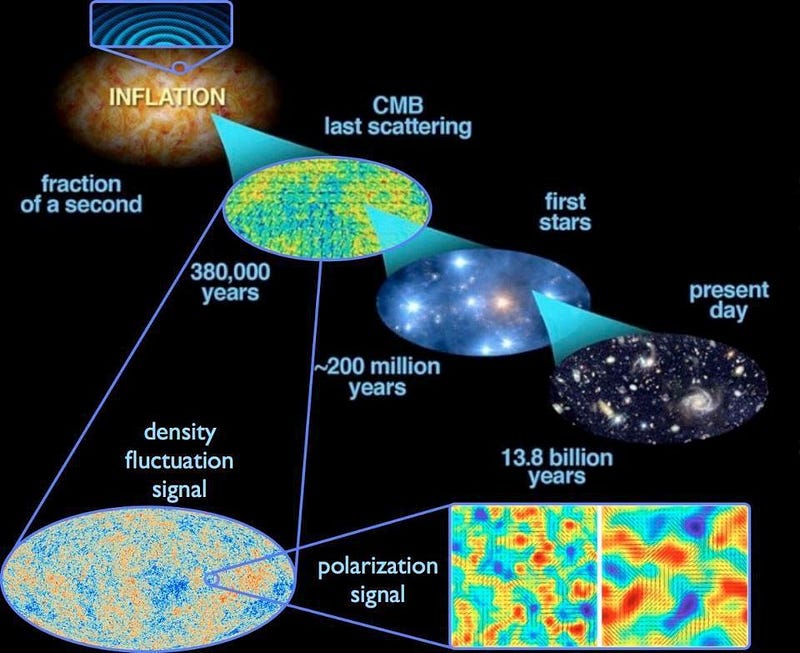
Honestly, it’s one of the greatest achievements for both theoretical and observational cosmology combined. If you start with a Universe with a known set of ingredients at the earliest times — at the start of the hot Big Bang — and you know the equations that govern your Universe, you can calculate how your Universe will evolve from that early stage until 380,000 years have passed: the time that the Universe has cooled to 3,000 K and will release the CMB.
Every different set of ingredients that you put in will have its own unique CMB that it produces. If you calculate how a Universe behaves with normal matter and radiation only, you only get about half the “wiggle” features that you’d get in a Universe with dark matter, too. If you add too much normal matter, the peaks get too high. If you add in spatial curvature, the size scales of the fluctuations change, getting smaller or larger (on average) depending on whether the curvature is positive or negative. And so on.
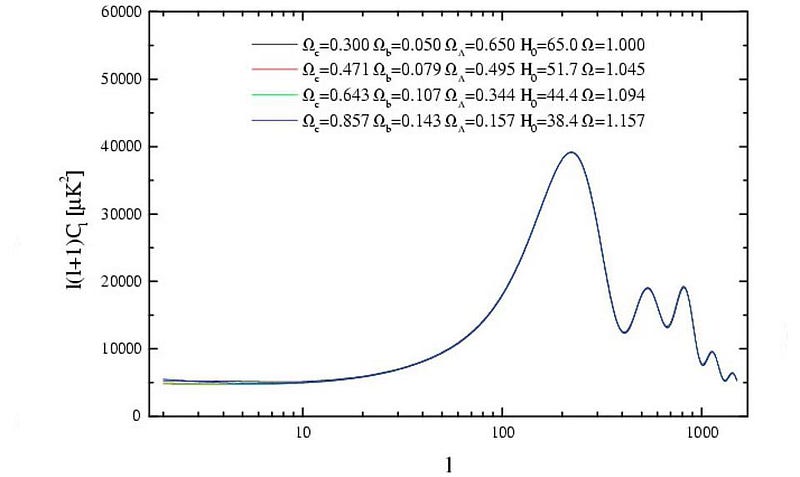
What’s fascinating about doing this analysis is that there are certain parameters that you can all vary together — a little more dark and normal matter, a little more dark energy, a lot more curvature, a slower expansion rate, etc. — that will all yield the same patterns of fluctuations. In physics, we call this a “degeneracy,” like how when you take the square root of four, you get multiple possible answers: +2 and -2.

Well, the temperature spectrum of the CMB is inherently degenerate: there are multiple possible cosmologies that can reproduce the patterns we see. But there are other components to the CMB as well, besides the temperature spectrum. There’s polarization. There’s a temperature-polarization cross-spectrum. There are different initial sets of fluctuations that the Universe could start off with in different models of inflation. When we look at all of the data together, there are only a small subset of models that can survive and successfully reproduce the CMB that we see. Even though it’s detailed, I’ve included what I’d call “the money plot” below.
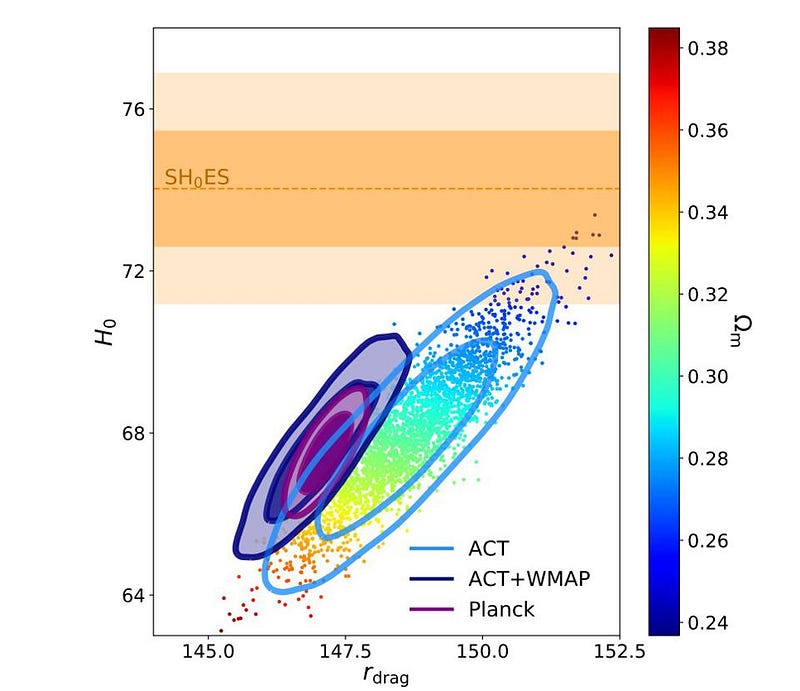
As you can see, the range of possible cosmologies that can work to fit the CMB are fairly narrow. The best-fit value comes in at 67–68 km/s/Mpc for the expansion rate, corresponding to a Universe with about 32% matter (5% normal matter and 27% dark matter) and 68% dark energy. If you try to move the expansion rate lower, you need more normal-and-dark matter, less dark energy, and a slight amount of positive spatial curvature. Similarly, if you try to move the expansion rate higher, you need less total matter and more dark energy, and possibly a little bit of negative spatial curvature. There’s very little actual wiggle-room, especially when you start considering other independent constraints.
The abundances of the light elements, for instance, tell us precisely how much normal matter exists. The measurements of galaxy clusters and large-scale structure tell us how much total matter, normal and dark combined, exists. And all the different constraints, together, tell us the age of the Universe: 13.8 billion years, with an uncertainty of only ~1%. The CMB is not just one data set, but many, and they all point towards the same picture. It’s all self-consistent, but it doesn’t paint the same picture that the cosmic distance ladder does. Until we figure out why, this will remain one of the biggest conundrums in modern cosmology.
Send in your Ask Ethan questions to startswithabang at gmail dot com!
Starts With A Bang is written by Ethan Siegel, Ph.D., author of Beyond The Galaxy, and Treknology: The Science of Star Trek from Tricorders to Warp Drive.