How Fast Is The Universe Expanding? Incompatible Answers Point To New Physics
As more data comes in, the puzzle gets deeper and deeper.
Whenever you set out to solve a problem, there are a series of steps you have to take in order to arrive at the answer. Assuming your methods are sound and you don’t make any major errors, the answer you get should be correct. It might be a little higher or a little lower that the “true” value, as measurement (and other) uncertainties are real and cannot be eliminated, but the answer you obtain should be independent of the method you use.
For more than a decade, a conundrum has been building in the field of astrophysics: although there are many different ways of measuring the rate at which the Universe is expanding, they fall into two different classes.
- One class relies on an early signal (from the Big Bang) that can be observed today, and those measurements cluster around 67 km/s/Mpc.
- The other class uses astrophysical objects to measure distance and redshift simultaneously, building up a suite of evidence to infer the expansion rate, where those measurements cluster around 74 km/s/Mpc.
A slew of new studies show that the mystery is now deepening even further.
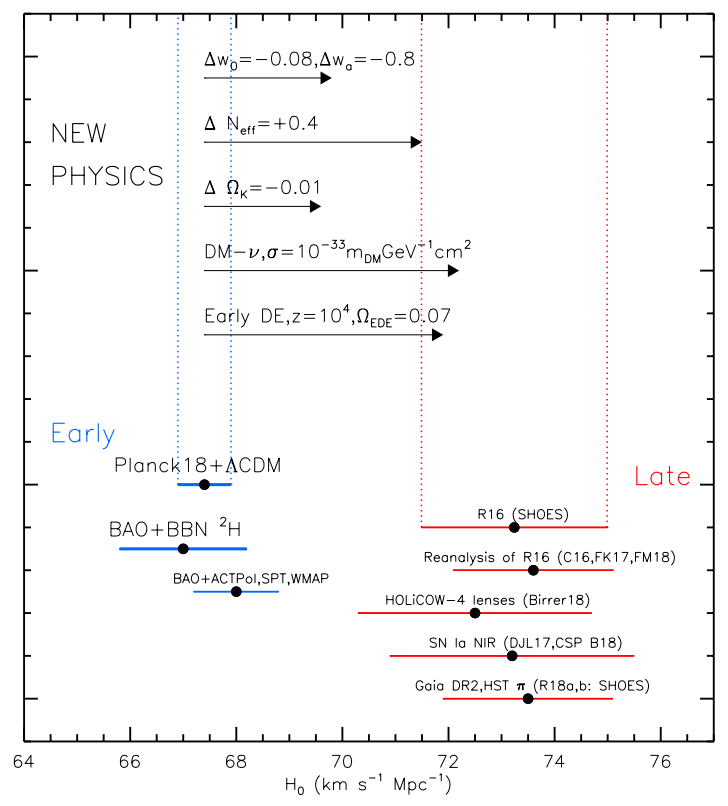
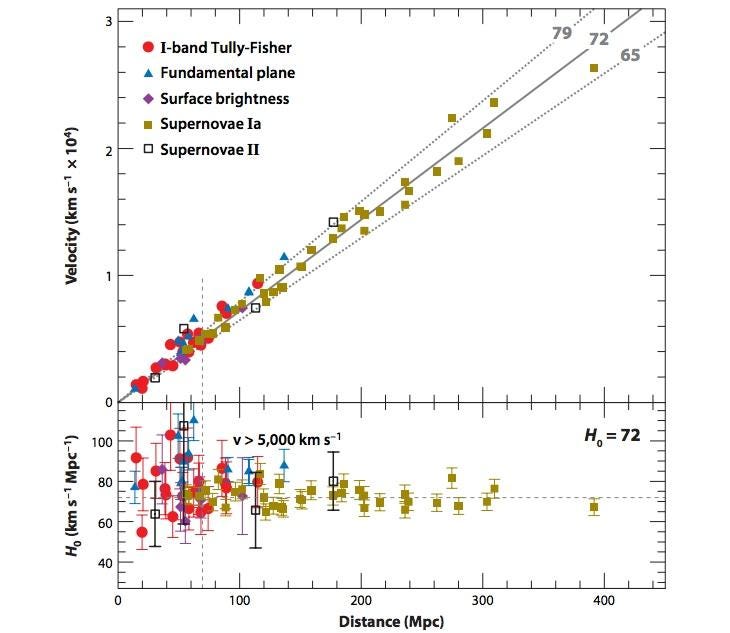
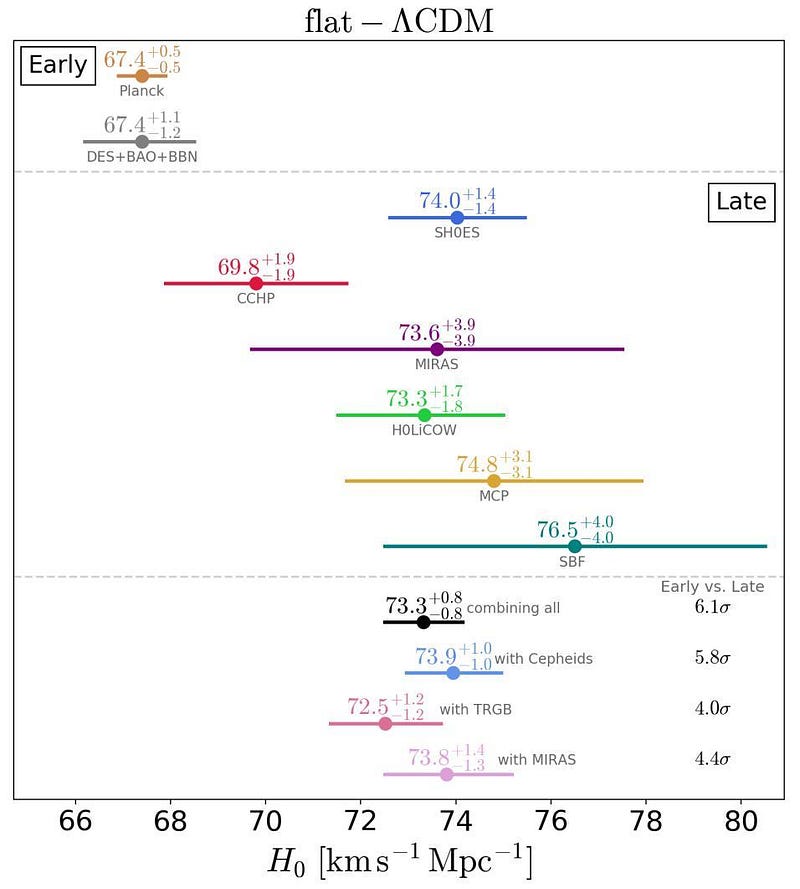
Above, you can see an illustration of a great many measurements — from different methods, experiments and data sets — of the present rate at which the Universe is expanding. On the one side, you can see results of the early signal method, which includes the imprint of the Universe’s expansion in the cosmic microwave background (from both Planck and WMAP), in the cosmic microwave background’s polarization data (an entirely independent data set), and from baryon acoustic oscillations which imprint themselves in the way galaxies cluster on distance scales of a few billion light-years.
On the other side, you can see results from the distance ladder method, which includes a myriad of independent methods using perhaps a dozen different distance indicators in various combinations. As you can clearly see, there’s a severe, non-overlapping dichotomy between the results that the two different classes of methods point to.
What do we do in a situation like this? Typically, we consider four options:
- The “lower value” groups are wrong, are all making the same error, and the true value is the larger one.
- The “higher value” groups are wrong, are all making the same error, and the true value is the smaller one.
- Both sets of groups have some valid points but have underestimated their errors, and the true value lies in between those results.
- Or nobody is wrong, and the value of the expansion rate that you measure is tied to the method you use because there is some new phenomena or physics at play in the Universe that we haven’t accounted for properly.
However, with the data that we now have in hand, particularly with a set of new papers that have come out just this year, the evidence is strongly pointing towards the fourth option.
The early signal method is based on some very straightforward physics. In a Universe filled with normal matter, dark matter, radiation, and dark energy, that starts of hot, dense, and expanding, and is governed by relativity, we can be sure that the following stages occur:
- regions of greater density will pull more matter and energy into them,
- the radiation pressure will increase when that occurs, pushing those overdense regions back outwards,
- while normal matter (which scatters off the radiation) and dark matter (which doesn’t) behave differently,
- leading to a scenario where the baryons (i.e., the normal matter) have an additional wave-like (or oscillatory) signature imprinted in them,
- leading to a signature distance scale — the acoustic scale — which shows up in the large-scale structure of the Universe at all times.
We can see this in maps of the CMB; we can see it in polarization maps of the CMB; we can see it in the large-scale structure of the Universe and how galaxies cluster. As the Universe expands, this signal will leave an imprint that depends on how the Universe has expanded.
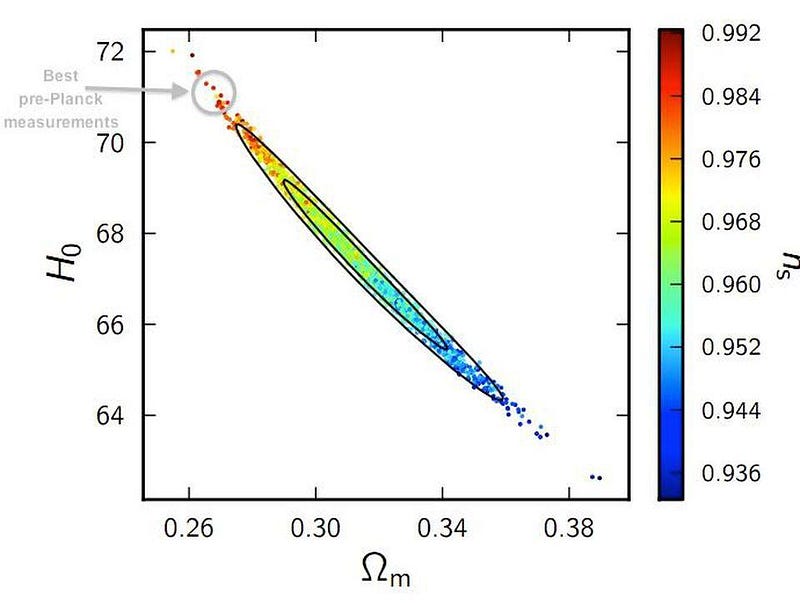
There are a number of degeneracies with this method, which (in physics-speak) means that you can adjust one cosmological parameter at the expense of some of the others, but that they’re all related. Above, you can see some of the degeneracies in the CMB fluctuations (from Planck), which show the best-fit to the Hubble expansion rate of 67 km/s/Mpc.
It also shows that there are other parameters, like the scalar spectral index and the overall matter density, that would change if you changed the value of the expansion rate. A value as high as 73 or 74 is inconsistent with the measured matter density (of ~32%) and the constraints on the scalar spectral index (which also come from the CMB or from baryon acoustic oscillations, of ~0.97), and this is across multiple, independent methods and data sets. If the value from these methods is unreliable, it’s because we made a profoundly wrong assumption about the workings of the Universe.
Of course, you might imagine there’s a problem with the other method: the late-signal method. This method works by measuring the light from an object whose intrinsic properties can be inferred from observations, and then by comparing the observed properties to the intrinsic properties, we can learn how the Universe has expanded since that light was emitted.
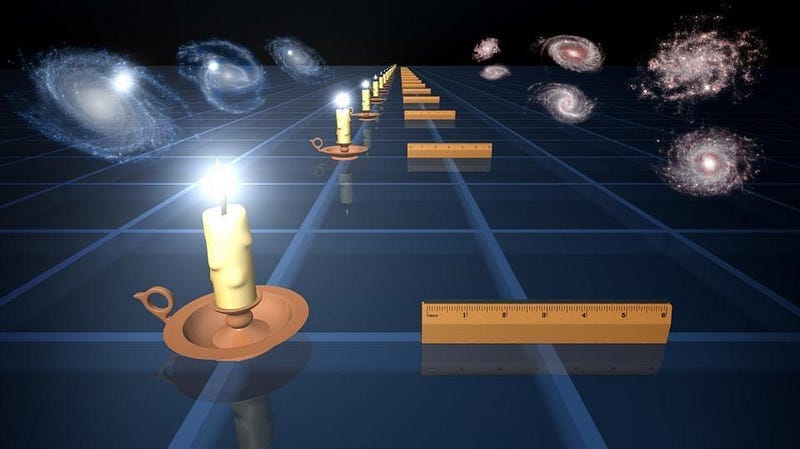
There are many different ways of making this measurement; some involve simply viewing a distant light source and measuring how the light evolved as it traveled from the source to our eyes, while others involve constructing what’s known as a cosmic distance ladder. By measuring nearby objects (like individual stars) directly, then finding galaxies with those same types of stars as well as other properties (like surface brightness fluctuations, rotational properties, or supernovae), we can then extend our distance ladder to the farthest reaches of the Universe, wherever our observations can reach.
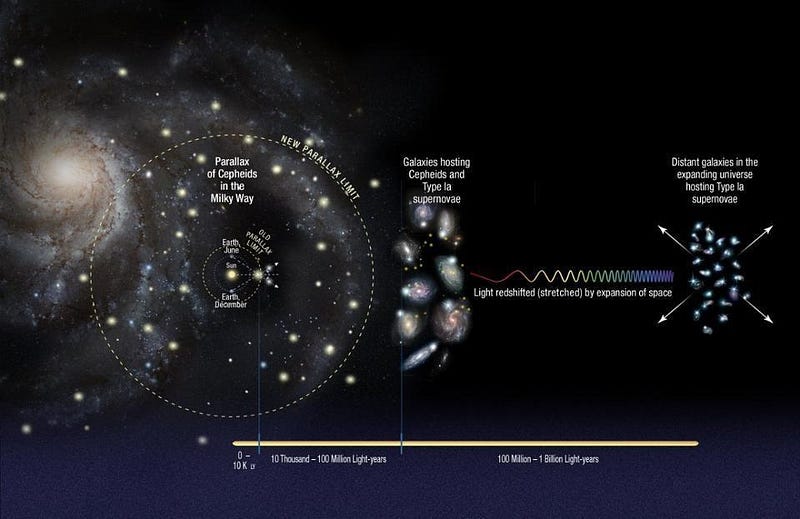
The best constraint using this method leverages parallax measurements of Cepheids in our galaxy, then adds in measurements of Cepheids in galaxies that also house type Ia supernovae, and then uses supernovae as distant as can be seen. However, many other methods using a wide variety of distance indicators (other types of stars, other properties of galaxies, other cataclysmic events, etc.) give similar answers.
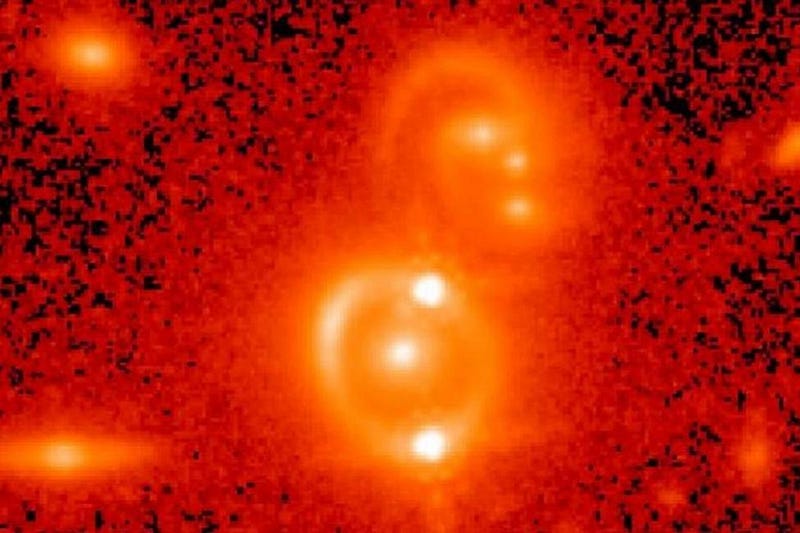
You might think there could be some sort of flaw with the earliest rungs on the distance ladder — like measuring the distances to stars in our galaxy — that might affect every attempt to utilize this method, but there are independent pathways that don’t rely on any particular rung (or measurement technique) at all. Distant gravitational lenses provide estimates of the expansion rate all on their own, and they agree with the other late-time signals, as opposed to the early relics.
With both sets of groups — the ones measuring 67 km/s/Mpc and the ones measuring 73 km/s/Mpc — you might wonder if the true answer might lie in the middle. After all, this is not the first time astronomers argued over the value of the expansion rate of the Universe: throughout the 1980s, one group argued for a value of 50–55 km/s/Mpc while the other argued for 90–100 km/s/Mpc. If you suggested a value to either group that was somewhere in the middle, you’d get laughed out of the room.
This was the original primary science goal of the Hubble Space Telescope, and the reason it was named Hubble: because its key project was to measure the expansion rate of the Universe, known as the Hubble constant. (Even though it should be the Hubble parameter, as it isn’t a constant.) What was originally an enormous controversy was chalked up to incorrect calibration assumptions, and the results of the HST key project, that the expansion rate was 72 ± 7 km/s/Mpc, looked like it would settle the issue at last.
With this recent dichotomy, however, the two different sets of groups have worked very hard to reduce all possible sources of uncertainty. Cross-checks between different early signal/relic teams all check out; their results really cannot be massaged to get a value higher than 68 or 69 km/s/Mpc without creating serious problems. The large collaborations working on CMB missions or large-scale structure surveys have vetted what they’ve done extensively, and no one has found a possible culprit.

On the other hand, the distance ladder/late-time signal mantle has been taken up by a wide variety of smaller teams and collaborations, and they met just a few months ago at a workshop. When they all presented their most up-to-date work, you saw something that, if you were an astronomer, should alarm you as far as importance goes.
Of all the different ways to measure the Hubble constant through the late-time signals available, only one technique — the one labeled “CCHP” (which uses stars at the tip of the red giant branch instead of Cepheid variable stars) — gives a value that drags the average down anywhere near the early signal method. If these errors were truly randomly distributed, which is how uncertainties normally work, you’d expect just as many values using this method that were biased low as there were values that were biased high.
A few prominent scientists, in an extremely interesting (but largely overlooked) new paper, went through the assumptions that were made in that work, and found a number of places where improvements could be made. After the reanalysis, which involved choosing a superior data set, better filter transformations, and improved ground-to-Hubble corrections, found that it led to an expansion rate that was ~4% greater than the CCHP analysis.
In other words, every single late-time, distance ladder method gives a result that is systematically higher than the mean value, while every single early signal/relic method gives a result that is systematically and substantially lower. The two sets of groups, when you average them together and compare them, differ from one another by 9% at a statistical significance that is now at 4.5-sigma. When the gold standard of 5-sigma is reached, this will officially be a robust result that cannot be ignored any further.
If the answer were actually in the middle, we’d expect at least some of the distance ladder methods to be closer to the early relic methods; none are. If no one is mistaken, then we have to start looking towards novel physics or astrophysics as the explanation.
Could there be a problem with our local density relative to the overall cosmic density? Could dark energy change over time? Could neutrinos have an additional coupling we don’t know about? Could the cosmic acoustic scale be different than the CMB data indicates? Unless some new, unexpected source of error is uncovered, these will be the questions that drive our understanding of the Universe’s expansion forward. It’s time to look beyond the mundane and seriously consider the more fantastic possibilities. At last, the data is strong enough to compel us.
Ethan Siegel is the author of Beyond the Galaxy and Treknology. You can pre-order his third book, currently in development: the Encyclopaedia Cosmologica.